
Knowledge Center
Introduction to Medical Thermography
What is Medical Thermography
Medical thermography, also known as infrared thermography, thermal imaging, infrared radiometry, or infrared imaging, is a non-invasive diagnostic technique that allows the examiner to visualise and quantify changes in skin surface temperature using ultra-sensitive infrared cameras.
Infrared Radiation is that portion of the electromagnetic spectrum that extends from the long wavelength, or the red end of the visible-light range to the microwave range. Invisible to the eye, it can be detected as a sensation of warmth on the skin. In principle, infrared radiation is emitted by every object above absolute zero, (-273°C) – natural or thermal radiation.
Infrared (IR) thermography is based on analysis of skin surface temperatures as a reflection of normal or abnormal human physiology using a highly specialized IR-camera. In a fraction of a second, a large area of the human body can be imaged to an accuracy of less than 0.1°C as well as a spatial resolution of 25-50 micrometers (6) and, dynamic responses to stimuli are easily documented.
Today, infra red thermal imaging has become one of the most efficient techniques for the study of skin temperature. Modern, infra-red digital cameras, employing focal-plane array technology, provide a sensitive tool for a multitude of clinical and experimental situations, ranging from breast risk assessment to musculoskeletal assessment . Thirty years of clinical use and more than 8,000 peer-reviewed studies in the medical literature have established thermography as a safe and effective means to examine the human body (Ammer & Ring, 1995; Cockburn , 2000). It is completely non-invasive, and as such does not require the use of radiation or other potentially harmful elements. Medical research has shown thermography to be a useful tool in research as well as being helpful in the assessment of Breast Health, Nervous System Disorders, Metabolic Disorders, Neck and Back Problems, Pain Syndromes, Arthritis, Vascular Disorders, and Soft Tissue Injuries among others (see Ammer & Ring, 1995 for references).
Many base line thermographic studies have been performed which show the anticipated normal pattern of temperature in a thermal image, both in steady state as well as dynamic situations, as for example during skin heating and cooling. Characteristic changes in the normal pattern are associated with different pathological phenomena. These changes provide the basis to be able to carry out objective non-invasive investigations, which are of diagnostic value.
Thermography Technology
Infrared thermography (IRT), thermal imaging, and thermal video are examples of infrared imaging science. Thermographic cameras detect radiation in the infrared range of the electromagnetic spectrum (roughly 9,000–14,000 nanometers or 9–14 µm) and produce images of that radiation, called thermograms. Since infrared radiation is emitted by all objects above absolute zero according to the black body radiation law, thermography makes it possible to see one’s environment with or without visible illumination. The amount of radiation emitted by an object increases with temperature; therefore, thermography allows one to see variations in temperature. When viewed through a thermal imaging camera, warm objects stand out well against cooler backgrounds; humans and other warm-blooded animals become easily visible against the environment, day or night. As a result, thermography is particularly useful to military and other users of surveillance cameras.
Thermography has a long history, although its use has increased dramatically with the commercial and industrial applications of the past fifty years. Government and airport personnel used thermography to detect suspected swine flu cases during the 2009 pandemic. Firefighters use thermography to see through smoke, to find persons, and to localize the base of a fire. Maintenance technicians use thermography to locate overheating joints and sections of power lines, which are a sign of impending failure. Building construction technicians can see thermal signatures that indicate heat leaks in faulty thermal insulation and can use the results to improve the efficiency of heating and air-conditioning units. Some physiological changes in human beings and other warm-blooded animals can also be monitored with thermal imaging during clinical diagnostics.
The appearance and operation of a modern thermographic camera is often similar to a camcorder. Often the live thermogram reveals temperature variations so clearly that a photograph is not necessary for analysis. A recording module is therefore not always built-in.
Non-specialized CCD and CMOS sensors have most of their spectral sensitivity in the visible light wavelength range. However by utilizing the “trailing” area of their spectral sensitivity, namely the part of the infrared spectrum called near-infrared (NIR), and by using off-the-shelf CCTV camera it is possible under certain circumstances to obtain true thermal images of objects with temperatures at about 280°C and higher.
Specialized thermal imaging cameras use focal plane arrays (FPAs) that respond to longer wavelengths (mid- and long-wavelength infrared). The most common types are InSb, InGaAs, HgCdTe and QWIP FPA. The newest technologies use low-cost, uncooled microbolometers as FPA sensors. Their resolution is considerably lower than that of optical cameras, mostly 160×120 or 320×240 pixels, up to 640×512 for the most expensive models. Thermal imaging cameras are much more expensive than their visible-spectrum counterparts, and higher-end models are often export-restricted due to the military uses for this technology. Older bolometers or more sensitive models such as InSb require cryogenic cooling, usually by a miniature Stirling cycle refrigerator or liquid nitrogen.
Thermal Energy
Thermal images, or thermograms, are actually visual displays of the amount of infrared energy emitted, transmitted, and reflected by an object. Because there are multiple sources of the infrared energy, it is difficult to get an accurate temperature of an object using this method. A thermal imaging camera is capable of performing algorithms to interpret that data and build an image. Although the image shows the viewer an approximation of the temperature at which the object is operating, the camera is actually using multiple sources of data based on the areas surrounding the object to determine that value rather than detecting the actual temperature. This phenomenon may become clearer upon consideration of the formula Incident Energy = Emitted Energy + Transmitted Energy + Reflected Energy where Incident Energy is the energy profile when viewed through a thermal imaging camera. Emitted Energy is generally what is intended to be measured. Transmitted Energy is the energy that passes through the subject from a remote thermal source. Reflected Energy is the amount of energy that reflects off the surface of the object from a remote thermal source.
If the object is radiating at a higher temperature than its surroundings, then power transfer will be taking place and power will be radiating from warm to cold following the principle stated in the Second Law of Thermodynamics. So if there is a cool area in the thermogram, that object will be absorbing the radiation emitted by the warm object. The ability of both objects to emit or absorb this radiation is called emissivity. Under outdoor environments, convective cooling from wind may also need to be considered when trying to get an accurate temperature reading.
The thermal imaging camera would next employ a series of mathematical algorithms. Since the camera is only able to see the electromagnetic radiation that is impossible to detect with the human eye, it will build a picture in the viewer and record a visible picture, usually in a JPG format.
In order to perform the role of noncontact temperature recorder, the camera will change the temperature of the object being viewed with its emissivity setting. Other algorithms can be used to affect the measurement, including the transmission ability of the transmitting medium (usually air) and the temperature of that transmitting medium. All these settings will affect the ultimate output for the temperature of the object being viewed. This functionality makes the thermal imaging camera an excellent tool for the maintenance of electrical and mechanical systems in industry and commerce. By using the proper camera settings and by being careful when capturing the image, electrical systems can be scanned and problems can be found. Faults with steam traps in steam heating systems are easy to locate.
In the energy savings area, the thermal imaging camera can do more. Because it can see the radiating temperature of an object as well as what that object is radiating at, the product of the radiation can be calculated using the Stefan–Boltzmann constant.
Emissivity
Emissivity is a term representing a material’s ability to emit thermal radiation. Each material has a different emissivity, and it can be difficult to determine the appropriate emissivity for a subject. A material’s emissivity can range from a theoretical 0.00 (completely not-emitting) to an equally-theoretical 1.00 (completely emitting); the emissivity often varies with temperature. An example of a substance with low emissivity would be silver, with an emissivity coefficient of .02. An example of a substance with high emissivity would be asphalt, with an emissivity coefficient of .98.
A black body is a theoretical object which will radiate infrared radiation at its contact temperature. If a thermocouple on a black body radiator reads 50 °C, the radiation the black body will give up will also be 50 °C. Therefore a true black body will have an emissivity of 1.
Since there is no such thing as a perfect black body, the infrared radiation of normal objects will appear to be less than the contact temperature. The rate (percentage) of emission of infrared radiation will thus be a fraction of the true contact temperature. This fraction is called emissivity.
Some objects have different emissivities in long wave as compared to mid wave emissions. Emissivities may also change as a function of temperature in some materials.
To make a temperature measurement of an object, the thermographer will refer to the emissivity table to choose the emissivity value of the object, which is then entered into the camera. The camera’s algorithm will correct the temperature by using the emissivity to calculate a temperature that more closely matches the actual contact temperature of the object.
If possible, the thermographer would try to test the emissivity of the object in question. This would be more accurate than attempting to determine the emissivity of the object via a table. The usual method of testing the emissivity is to place a material of known high emissivity in contact with the surface of the object. The material of known emissivity can be as complex as industrial emissivity spray which is produced specifically for this purpose, or it can be as simple as standard black insulation tape, emissivity 0.97. A temperature reading can then be taken of the object with the emissivity level on the imager set to the value of the test material. This will give an accurate value of the temperature of the object. The temperature can then be read on a part of the object not covered with the test material. If the temperature reading is different, the emissivity level on the imager can be adjusted until the object reads the same temperature. This will give the thermographer a much more accurate emissivity reading. There are times, however, when an emissivity test is not possible due to dangerous or inaccessible conditions. In these situations the thermographer must rely on tables.
Difference between infrared film and thermography
IR film is sensitive to infrared (IR) radiation in the 250°C to 500°C range, while the range of thermography is approximately -50°C to over 2,000°C. So, for an IR film to work thermographically, it must be over 250°C or be reflecting infrared radiation from something that is at least that hot. (Usually, infrared photographic film is used in conjunction with an IR illuminator, which is a filtered incandescent source or IR diode illuminator, or else with an IR flash (usually a xenon flash that is IR filtered). These correspond with “active” near-IR modes as discussed in the next section.
Night vision infrared devices image in the near-infrared, just beyond the visual spectrum, and can see emitted or reflected near-infrared in complete visual darkness. However, again, these are not usually used for thermography due to the high temperature requirements, but are instead used with active near-IR sources.
Starlight-type night vision devices generally only magnify ambient light.
Passive vs. active thermography
All objects above the absolute zero temperature (0 K) emit infrared radiation. Hence, an excellent way to measure thermal variations is to use an infrared vision device, usually a focal plane array (FPA) infrared camera capable of detecting radiation in the mid (3 to 5 μm) and long (7 to 14 μm) wave infrared bands, denoted as MWIR and LWIR, corresponding to two of the high transmittance infrared windows. Abnormal temperature profiles at the surface of an object are an indication of a potential problem.
In passive thermography, the features of interest are naturally at a higher or lower temperature than the background. Passive thermography has many applications such as surveillance of people on a scene and medical diagnosis (specifically thermology).
In active thermography, an energy source is required to produce a thermal contrast between the feature of interest and the background. The active approach is necessary in many cases given that the inspected parts are usually in equilibrium with the surroundings.
Historical Background
Using thermal imaging cameras as a medical diagnostic tool began in the late 1960’s. Initially it did not find its beginnings in main stream medicine. In fact it is a technology that has evolved primarily from a defense industry’s need and secondarily as an engineering tool. In the 1970’s an effort came from the National Cancer Institute’s Breast Cancer Detection and Demonstration project. Medical thermal imaging is in fact based on the fundamental science of physics and physiology. To put it simply the human body emits copious amounts of infrared radiation and infrared cameras see this radiant energy. Unlike x-rays the process is totally non intrusive. The sensor(s) in the camera are sensitive to emitted radiated energy from the body. You simply look at the body with the camera and you get a thermal image. Interpretation is a major issue in that even biological twins will have a different thermal profile. Temperature and the human body
Thermal imaging systems see radiant energy emitted from the first 1/1000 of an inch of the surface of the objects. In fact infrared energy is emitted by every object on the planet. Non contact infrared sensors surround us in modern life on a day to day basis. From traffic lights to the infrared motion sensors in our bedroom lighting, airport toilets, automated doors at the local grocery store or the faucets that turn on and off without a touch; infrared sensors impact our lives daily in a very helpful way!
Temperature is the number one form of measurement used in any process; this includes the human body. When you go to the doctor what is one of the first clinical tests performed? In most cases the nurse will take your temperature and blood pressure. Boyle’s law demonstrates there is a direct relationship between temperature and pressure. In fact one of the primary reasons Daniel Gabriel Fahrenheit (1717) developed the mercury thermometer was to measure the temperature of the human body. Hippocrates (400 BC) would cover the body with a thin layer of water and mud and look at the area that would dry first to find internal organs that had an elevated temperature.
Infrared (IR) mechanical scanning technology using liquid nitrogen, thermoelectric or stirling coolers has been around for several years. Line scanner’s and line cameras utilizing this technology have been used for years in small numbers for very specific medical applications. In the 1970’s, there were more infrared imaging cameras sold to the medical industry than there were cameras sold for electrical and mechanical applications.
A number of physicians and research scientists have kept the technology alive and progressing forward. The first meaningful study of infrared imaging and breast oncology was performed at the Cancer Institute of Pasteur University in Marseilles France and was published in 1975. This study incorporated thousands of case studies over many years. Also in 1975, Judas Folkman published his theory of neo-angiogenesis of solid malignant tumors. In the late 1980’s a group of German anatomists from University of Essen demonstrated the primitive lacunae structure of neo-angiogenesis. Today thermal imaging studies abound; from a breast cancer study being performed at Cornell University, to a study at the University of Houston using a thermal camera in development of a lie detection system. Medical Applications There are many medical applications and new papers are being published almost daily. A few medical applications are listed below.
1. SARS Fever Screening
2. Breast Cancer
3. Prostate Cancer
4. Spinal Screening
5. Full Body Screening
6. Skin Cancer
7. Chronic Pain
8. Equine Exams
9. Race Horse Exams
10. Vascular Exams
11. Chiropractic Exams
12. Animal Research
13. Night Patient observation
14. Open Heart Surgery
15. Burn Depth Assessment
Thermal Imaging Terms and Definitions
A
Absolute Zero – The temperature that is zero on the Kelvin or Rankine temperature scales. The temperature at which a material is at its lowest energy state.
Absorptivity, a [Absorptance] – The proportion (as a fraction of 1) of the radiant energy impinging on a material’s surface that is absorbed into the material. For a blackbody, this is unity (1.0). Technically, absorptivity is the internal absorptance per unit path length. In thermography, the two terms are often used interchangeably.
Accuracy [of Measurement] – The maximum deviation, expressed in % of scale or in degrees Celsius or degrees Fahrenheit, that the reading of an instrument will deviate from an acceptable standard reference.
Ambient Operating Range – Range of ambient temperatures over which an instrument is designed to operate within published performance specifications.
Ambient Temperature – Temperature of the air in the vicinity of the target (target ambient) or the instrument (instrument ambient).
Ambient Temperature Compensation – Correction built into an instrument to provide automatic compensation in the measurement for variations in instrument ambient temperature.
Anomaly – Any irregularity, such as a thermal anomaly on an otherwise isothermal surface. Any indication that deviates from what is expected.
Apparent Temperature – The target surface temperature indicated by an infrared point sensor, line scanner or imager before temperature corrections are made.
Artifact – A product of artificial character due to extraneous agency; an error caused by an uncompensated anomaly. In thermography, an emissivity artifact simulates a change in surface temperature but is not a real change. A hot solar reflection or a cold reflection due to narcissus would be examples of artifacts.
Atmospheric Windows [Infrared] – The spectral intervals within the infrared spectrum in which the atmosphere transmits radiant energy well (atmospheric absorption is a minimum.). These are roughly defined as 3-5 µm and 8-14 µm.
B
Background Temperature, Instrument – The apparent temperature of the radiant energy impinging on an object that is reflected off the object and enters the instrument. Originates from the scene behind and surrounding the instrument, as viewed from the target. The reflection of this background appears in the image and affects temperature measurements. Good quality quantitative thermal sensing and imaging instruments provide a means for correcting measurements for this reflection.
Background Temperature, Target – Apparent ambient temperature of the scene behind and surrounding the target, as viewed from the instrument. When the FOV of a point sensing instrument is larger than the target, the target background temperature will affect the instrument reading. Also called surroundings temperature, foreground temperature.
Blackbody, Blackbody Radiator – A perfect radiator, one that radiates the maximum number of photons in a unit time from a unit area in a specified spectral interval into a hemisphere that any body in thermodynamic equilibrium at the same temperature can radiate. It follows that a blackbody absorbs all radiant energy impinging on it and reflects and transmits none; thus a surface with emissivity of unity (1.0).
Blackbody Curves – Plots of radiant power spectral exitance (W/m²/mm) vs. wavelength for various temperatures according to the Planck equation. These curves show the maximum amount of energy at any given wavelength that can be radiated by an object due solely to its temperature. Also called Planck curves.
Bolometer, Infrared [Micro-Bolometer] – A type of thermal detector commonly used in uncooled radiometers.
C
Calibration – Checking and/or adjusting an instrument such that its readings agree with a standard. Calibration removes instrument systematic error and quantifies the instrument random error.
Calibration Check – A routine check of an instrument against a reference to ensure that the instrument has not deviated from calibration since its last use.
Calibration Accuracy – The accuracy, to which a calibration is performed, usually based on the accuracy and sensitivity of the instruments and references used in the calibration.
Calibration Source, Infrared – A blackbody or other target of known temperature and effective emissivity used as a calibration reference.
Capacitance, Thermal – This term is used to describe heat capacity in terms of an electrical analog, where loss of heat in analogous to loss of charge on a capacitor. Structures with high thermal capacitance lose heat more slowly than those structures with low thermal capacitance.
Capacity, Heat – The heat capacity of a material or structure describes its ability to store heat. It is the product of the specific heat (c¬¬¬p) and the density (r) of the material. This means that denser materials generally will have higher heat capacities than porous materials.
Celsius [Centigrade] – A temperature scale based on 0°C as the freezing point of water and 100°C as the boiling point of water at standard atmospheric pressure; a relative scale related to the Kelvin scale [0°C = 273.12 K. 1 C° (DT) = 1 K. (DT)]
Color – A term sometimes used to define wavelength or spectral interval, as in two-color radiometry (meaning a method that measures in two spectral intervals); also used conventionally (visual color) as a means of displaying a thermal image, as in color thermogram.
Colored Body – See non-graybody.
Conductance, Thermal – A measure of the ability of a material of defined thickness and cross-sectional area to conduct heat. Related to the material property, thermal conductivity. The inversed of thermal resistance (C = 1/R).
Conduction, Thermal – The only mode of heat flow in solids, but can also take place in liquids and gases. It occurs as the result of atomic vibrations (in solids) and molecular collisions (in liquids and gases) whereby energy is transferred from locations of higher temperature to locations of lower temperature.
Conductivity, Thermal, [K] – A material property defining the relative capability to carry heat by conduction in a static temperature gradient. Conductivity varies slightly with temperature in solids and liquids and with temperature and pressure in gases. It is high for metals (copper has a K of 380 W/m-°C) and low for porous materials (concrete has a K of 1.0) and gases.
Convection – The form of heat transfer that takes place in a moving medium and is almost always associated with transfer between a solid (surface) and a moving fluid (such as air), whereby energy in transferred from higher temperature sites to lower temperature sites.
D
Delta T – the temperature difference between two targets usually of comparable targets under comparable conditions.
Detector, Infrared – A transducer element that converts incoming infrared radiant energy impinging on its sensitive surface into a useful electrical signal.
Diffuse Reflector – A surface that reflects a portion of the incident radiation in such a manner that the reflected radiation is equal in all directions. A mirror is not a diffuse reflector.
Diffusivity, Thermal, [a] – (Note: same symbol as absorptive, may be confusing.) The ratio of conductivity (k) to the product of density (r) and specific heat (Cp) [a = k/rCp cm² sec¬ 1]. The ability of a material to distribute thermal energy after a change in heat input. A body with a high diffusivity will reach a uniform temperature distribution faster than a body with lower diffusivity.
D* [Detectivity Star] – Sensitivity figure of merit of an infrared detector–detectivity expressed inversely so that higher D*s indicate better performance; taken at specific test conditions of chopping frequency and information bandwidth and displayed as a function of spectral wavelength.
Direct Thermography – Thermal imaging and measurement of a surface whose thermal signature is, or is directly affected by the target of concern. That is, the target of concern has little or no thermal insulation between it and the surface measured.
Display Resolution, Thermal – The precision with which an instrument displays its assigned measurement parameter (temperature), usually expressed in degrees, tenths of degrees, hundredths of degrees, etc.
E
Effective Emissivity [e] (also called emittance, but emittance is a less preferable term because it was formerly used to describe radiant exitance). – The measured emissive value of a particular surface under existing measurement conditions (rather than the generic tabulated value for the surface material) that can be used to correct a specific measuring instrument to provide a correct temperature measurement.
Effusivity, Thermal [e] – A measure of the resistance of a material to temperature change
E = ÖkrCp cal Cm2 °C-1 sec½
where:
K = thermal conductivity
r = bulk density
C¬¬¬¬¬¬¬¬p = specific heat
Emissivity [e] – The ratio of a target surface’s radiance to that of a blackbody at the same temperature, viewed from the same angle and over the same spectral interval; a generic look-up value for a material. Values range from 0 to 1.0. Alternatively, the ratio of a flat, optically polished, opaque target surface radiance to that of a blackbody at the same temperature, viewed from the same angle and over the same spectral interval. The latter definition characterizes the property of the material. When used this way, emittance is used to characterize the material when it is other than flat, optically polished and opaque.
Emittance [e] – The ratio of a target surface’s radiance to that of a blackbody at the same temperature, viewed from the same angle over the same spectral interval; a generic look-up value for a material. Values range from 0 to 1.0.
EMI/RFI Noise – Disturbances to electrical signals caused by electromagnetic interference (EMI) or radio frequency interference (RFI). In thermography, this may cause noise patterns to appear on the display.
Environmental Rating – A rating given an operating unit (typically an electrical or mechanical enclosure) to indicate the limits of the environmental conditions under which the unit will function reliably and within published performance specifications.
Exitance, Radiant [Also Called Radiosity] – Total infrared energy (radiant flux) leaving a target surface. This is composed of radiated, reflected and transmitted components. Only the radiated component is related to target surface temperature.
F
Fahrenheit – A temperature scale based on 32°F as the freezing point of water and 212°F as the boiling point of water at standard atmospheric pressure; a relative scale related to the Rankine scale [0°F = 459.67.R; 1 F° (DT) = 1 R (DT)].
Field of View [FOV] – The angular subtense (expressed in angular degrees or radians per side if rectangular, and angular degrees or radians if circular) over which an instrument will integrate all incoming radiant energy. In a radiation thermometer this defines the target spot size; in a scanner or imager this defines the scan angle or picture size or total field of view (TFOV).
Fiber Optic, Infrared – A flexible fiber made of a material that transmits infrared energy, used for making non-contact temperature measurements when there is not a direct line of sight between the instrument and the target.
Filter, Spectral – An optical element, usually transmissive, used to restrict the spectral band of energy received by an instrument’s detector.
Flame Filter – A filter of a specific waveband used to minimize the effects of flame, enabling the IR camera to “see” through the flame. The specific waveband is a region where the transmittance of flame approaches unity. Center wavelengths are typically 3.9 mm for shortwave instruments and 10.6 mm for longwave.
Focal Plane Array [FPA] – A linear or two-dimensional matrix of detector elements, typically used at the focal plane of an instrument. In thermography, rectangular FPAs are used in “staring” (non-scanning) infrared imagers. These are called IRFPA imagers.
Focal Point – The point at which the instruments optics image the infrared detector at the target plane. In a radiation thermometer, this is where the spot size is the smallest. In a scanner or imager, this is where the instantaneous field of view (IFOV) is smallest.
Foreground Temperature [See Instrument Ambient Background] – Temperature of the scene behind and surrounding the instrument as viewed from the target.
Frame Repetition Rate – The time it takes an infrared imager to scan (update) every thermogram picture element (pixel); in frames per second.
Full Scale – The span between the minimum value and the maximum value that any instrument is capable of measuring. In a thermometer, this would be the span between the highest and lowest temperature that can be measured.
G
Graybody – A radiating object whose emissivity is a constant value less than unity (1.0). over a specific spectral range.
H
Heat Transfer – The movement of heat from one point to another by conduction, convection and/or radiation.
Hertz [Hz] – A unit of measurement of signal frequency; 1 Hz = cycle per second.
Herschel, Sir William – Discovered infrared in 1800.
I
Imager, Infrared – An infrared instrument that collects the infrared radiant energy from a target surface and produces an image in monochrome (black and white) or color, where the gray shades or color hues correspond respectively to target exitance.
Image Display Tone – Gray shade or color hue on a thermogram.
Image Processing, Thermal – Analysis of thermal images, usually by computer; enhancing the image to prepare it for computer or visual analysis. In the case of an infrared image or thermogram, this could include temperature scaling, spot temperature measurements, thermal profiles, image manipulation, subtraction and storage.
Imaging Radiometer – An infrared thermal imager that provides quantitative thermal images.
Indirect Thermography – Thermal imaging and measurement of a surface which is indirectly affected by the target of concern. That is, the target of concern is thermally decoupled from the surface due to thermal insulation, such as an air gap or a radiant barrier.
Indium Antimonide [InSb] – A material from which fast, sensitive photo-detectors used in infrared scanners and imagers are made. Such detectors usually require cooling while in operation.
Inertia, Thermal – See thermal effusivity.
Infrared [IR] – The infrared spectrum is loosely defined as that portion of the electromagnetic continuum extending from the red visible (0.75 mm to about 1,000 mm) . Because of instrument design considerations and the infrared transmission characteristics of the atmosphere, however, most infrared measurements are made between 0.75 and 20 mm.
Infrared Focal Plane Array [IRFPA] – A linear or two-dimensional matrix of individual infrared detector elements, typically used as a detector in an infrared imaging instrument.
IRFPA Imager or Camera – An infrared imaging instrument that incorporates a two-dimensional IRFPA (focal plane array) and produces a thermogram without mechanical scanning.
Infrared Radiation Thermometer – An instrument that converts incoming infrared radiant energy from a spot on a target surface to a measurement value that can be related to the temperature of that spot.
Infrared Thermal Imager – An Instrument or system that converts incoming infrared radiant energy from a target surface to a thermal map, or thermogram, on which color hues or gray shades can be related to the temperature distribution on that surface.
Instantaneous Field of View [IFOV] – The angular subtense (expressed in angular degrees or radians per side if rectangular and angular degrees or radians if round) found by the ratio of the detector dimension divided by the instrument focal length; the projection of the detector at the target plane. In a radiation thermometer this defines the target spot size; in a line scanner or imager it represents one resolution element in a scan line or thermogram and is a measure of spatial resolution.
Isotherm – A pattern superimposed on a thermogram or on a line scan that includes or highlights all points that have the same apparent temperature.
K
Kelvin – Absolute temperature scale related to the Celsius (or Centigrade) relative scale. The Kelvin unit is equal to 1 C°; 0 Kelvin = -273.16°C; the degree sign and the word “degrees” are not used in describing Kelvin temperatures.
Kirchoff’s Law – In thermal equilibrium the absorbtivity of an opaque surface equals its emissivity (a = e).
L
Laser Pyrometer – An infrared radiation thermometer that projects a laser beam to the target, uses the reflected laser energy to compute target effective emissivity and automatically computes target temperature (assuming that the target is a diffuse reflector)—not to be confused with laser-aided aiming devices on some radiation thermometers.
Latent Heat – Also called “hidden heat” as heat is added or removed without changing the temperature. The amount of heat required (or released) for a change of phase from solid to liquid and liquid to gas (or vice versa). The latent heat of vaporization is the amount of heat required to change one gram of liquid to vapor without change of temperature. The latent heat of fusion is the amount of heat to melt one gram of solid to liquid with no temperature change.
Line Scan Rate – The number of target lines scanned by an infrared scanner or imager in one second.
Line Scanner, Infrared – An instrument that scans an field of view along a straight line at the target plane in order to collect infrared radiant energy from a line on the target surface, usually done by incorporating one scanning element within the instrument. If the target (such as a sheet or web process) moves at a fixed rate normal to the line scan direction, the result can be displayed as a thermogram.
M
Measurement Spatial Resolution, IFOVmeas – The smallest target spot size on which an infrared imager can produce a measurement, expressed in terms of angular subtense (mrad per side). The slit response function (SRF) test is used to measure IFOVmeas.
Medium, Transmitting Medium – The composition of the measurement path between a target surface and the measuring instrument through which the radiant energy propagates. This can be vacuum, gaseous (such as air), solid, liquid or any combination of these.
Mercury Cadmium Telluride MCT [HgCdTe] – A material used for fast, sensitive infrared photo-detectors used in infrared sensors, scanners and imagers that requires cooled operation.
Micro-Cooler – A small, palm size cooler based on the Stirling cycle that cools an infrared detector or focal plane array to liquid nitrogen temperature (77K).
Micron [Micrometer] [m or, mm ] – One millionth of a meter; a unit used to express wavelength in the infrared.
Milliradian [MRAD] – One thousandth of a radian (1 radian = 180°/p); a unit used to express instrument angular field of view; an angle whose tangent is equal to 0.001; 1 mrad = 0.05729578°)
Minimum Resolvable Temperature [Difference], MRT(D) – Thermal resolution; thermal sensitivity – the smallest temperature difference that an instrument can clearly distinguish out of the noise, taking into account target size and characteristics of the display and the subjective interpretation of the operator. The limit of MRTD is MDTD (minimum detectable temperature difference). MDTD is the MRTD of an extended source target, that is, a target large enough to be fully resolved by the instrument.
Modulation – In general, the changes in one wave train caused by another; in thermal scanning and imaging, image luminant contrast; (Lmax – Lmin)/(Lmax + Lmin).
Modulation Transfer Function [MTF] – A measure of the ability of an imaging system to reproduce the image of a target. A formalized procedure is used to measure MTF. It assesses the spatial frequency resolution of a scanning or imaging system as a function of distance to the target.
N
Night Vision – Click Here for Information
Noise Equivalent Temperature [Difference], NET[D] – The temperature difference that is just equal to the rms noise signal; a measure of thermal resolution; (thermal sensitivity), but not taking into account target size, characteristics of the display and the subjective interpretation of the operator.
NIST, NIST Traceability – The National Institute of Standards and Technology (formerly NBS). Traceability to NIST is a means of ensuring that reference standards remain valid and their calibration remains current.
Non-Gray body – An object whose emissivity varies with wavelength over the wavelength interval of interest. A radiating object that does not have a spectral radiation distribution similar to a blackbody; also called a “colored body” or “realbody”. Glass and plastic films are examples of non-graybodies. An object can be a graybody over one wavelength interval and a non-gray body over another.
O
Objective, Objective Lens – The primary lens of an optical system, on an infrared instrument, usually the interchangeable lens that defines the total field of view.
Opaque – In thermography, an opaque material is one that does not transmit thermal infrared energy, ( t = 0).
Optical Element, Infrared – Any element that collects, transmits, restricts or reflects infrared energy as part of an infrared sensing or imaging instrument.
Oversampling – Collecting samples at a rate higher than the Nyquist critical frequency, fc = 1/(2D), where D is the sampling interval. Applies to both time and spatial domains.
P
Peak – Hold – A feature of an instrument whereby an output signal is maintained at the peak instantaneous measurement for a specified duration.
Photo-Detector [Photon Detector] – A type of infrared detector that has fast response, (on the order of microseconds), limited spectral response and usually requires cooled operation; photo-detectors are used in infrared radiation thermometers, scanners and imagers.
Pixel – Abbreviation for picture element. In infrared technology a pixel is a focal plane array element, for scanning systems is defined by the IFOV, for spot radiometers by FOV.
Planck, Max Karl Ernst Ludwig – German physicist who incorporated quantum physics into the blackbody spectral radiance equation, giving rise to blackbody curves.
Pyroelectric Detector – A type of thermal infrared detector that acts as a current source with its output proportional to the rate of change of its temperature.
Pyroelectric Vidicon [PEV], Also Called Pyrovidicon – A video camera tube with its receiving element fabricated of pyroelectric material and sensitive to wavelengths from about 2 to 20 mm; used in infrared thermal viewers.
Pyrometer – Any instrument used for temperature measurement. A radiation or brightness pyrometer measures visible energy and relates it to brightness or color temperature. An infrared pyrometer measures infrared radiation and relates it to target surface temperature.
Q
Qualitative Measurement – the process of obtaining and interpreting thermal images based on thermal contrast in order to identify anomalies; the purpose is more to determine where a temperature difference exists than what the temperature difference is between the target and its surroundings.
Quantitative Measurement – the process of obtaining thermal images with correct temperature readings. Especially useful in situations when the exact temperature or temperature difference of the target determines whether it falls in or out of a determined criteria or range of acceptability. Also important to R & D and process control situations.
R
Radian – An angular measurement equal to the ratio of the arc length of a circle to its radius. The circumference of a circle is 2p times the radius. Thus p radians = 180 degrees, and 1 radian = 57.29578 degrees.
Radiation, Thermal – The mode of heat flow that occurs by emission and absorption of electromagnetic radiation, propagating at the speed of light. Unlike conductive and convective heat flow, it is capable of propagating across a vacuum. The form of heat transfer that allows infrared thermography to work since infrared energy travels from the target to the detector by radiation.
Source: http://www.infraredcamerasinc.com/thermal-imaging-terms.html
Infrared Breast Thermography
Breast Imaging
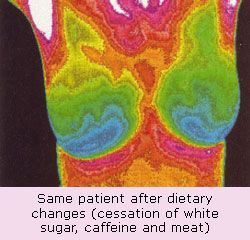
Infrared Breast Thermography is a safe, non-ionizing, non-contact study of breast skin temperature that is useful in breast health risk assessment and as an adjunct in the detection of physiologic changes associated with breast cancer. Internationally peer reviewed Guidelines for Breast Thermography have been developed by the American Academy of Thermology in 2012.
Thermography measures, images and maps microcirculatory shunting associated with breast circulatory changes in the skin. As with most physiologic studies, anatomic findings may not correlate and may not even be present (physiologic findings tend to predate structural findings). Thermography can however play an important adjunctive role in clinical diagnosis and in distinguishing between benign, early, advanced, and progressive disease.
Breast thermography can also play a useful role in monitoring treatment effects.
Cancer cells need increased blood flow (angiogenesis) in order to “take” over surrounding breast tissue. They also have an increased metabolic rate, which translates into an increase in temperature compared to surrounding normal tissue. By studying breast tissue with infrared imaging early changes in blood flow can be detected and progressive changes can be assessed over time.
In 1997 Gamagami, Silverstein & Waisman published that :
Angiogenesis was the first sign appearing on mammography before the appearance of image of breast cancer, predicting in 91 % of the cases which breast might develop breast carcinoma. This is an important finding in the detection of the early stages of breast cancer development.
Infra-red imaging goes hand in hand with mammography. Hypervascularity and hyperthermia could be shown in 86% of non-palpable breast cancer. In 15% it helped to detect the cancer upon an unsuspicious image on mammography.
Infra-red imaging was found to be the only test showing the efficiency of chemotherapy in inflammatory breast carcinoma.
While Breast Thermography is not a stand alone tool in the diagnosis of breast cancer no screening tool (including X-ray mammography and Ultrasound) provides excellent predictability when used by itself. A combination of tools that incorporates Infrared Thermography has been shown to boost both sensitivity and specificity.
In an 4 year, five institution article published in the American Journal of Radiology (2003) the authors concluded that Infrared Mammography is a safe noninvasive procedure that is valuable as an adjunct to X-Ray Mammography in determining whether a lesion is benign or malignant.
There was 97% sensitivity when identified lesions were biopsied, however only a 14% specificity. This means that Infrared Mammography is very sensitive at breast cancer detection, however identified lesions are most often not cancer (usually they are microcalcifications).
There was also a 95% negative predictive value, and a 24% positive predictive value. This means that if an Infrared Mammogram is negative there is a 95% chance that there is no cancer and that if it is positive that there is a 24% chance that cancer may later be discovered.
Likewise, in 2008 The American Journal of Surgery (pages 523-526) published that Infrared Mammography identified 58 of 60 malignancies, with 97% sensitivity, 44% specificity, and 82% negative predictive value. The authors concluded that Infrared Mammography is a valuable adjunct to X-ray mammography and ultrasound, especially in women with dense breast tissue.
Thermal imaging is an examination of physiology that is complimentary to anatomical imaging techniques. Although proven to be highly accurate, thermal imaging is an adjunctive procedure; and as such, it is not intended to replace anatomic studies such as mammography, ultrasound, MRI, CT, X-ray, or others.
Breast Health Assessment
The earliest possible indication of abnormalities allows for the earliest possible intervention.
Breast_Assessment_1
Thermography detects the physiologic changes in the breast tissue that have been shown to correlate with cancerous or pre-cancerous states. It is widely acknowledged that cancers, even in their earliest stages need nutrients to maintain or accelerate their growth. In order to facilitate this process blood vessels are caused to remain open, inactive blood vessels are activated and new ones are formed, a process known as neoangiogenisis. This vascular process causes an increase in surface temperature in the affected regions which can be viewed with infrared imaging cameras. Additionally the newly formed or activated blood vessels have a distinct appearance which thermography can detect.
Thermography is a physiologic test which can demonstrate the aforementioned changes. As such it cannot identify tumors. It provides the clinician with extremely useful information regarding areas of abnormality which can be examined clinically and with anatomic tests. Since thermal imaging detects changes at the cellular level, studies suggest that this test can detect activity eight to ten years BEFORE any other test. This makes it unique in that it affords us the opportunity to view changes before the actual formation of the tumor. Studies have shown that by the time a tumor has grown to sufficient size to be detectable by physical examination or mammography, it has in fact been growing for several years achieving more than twenty-five doublings of the malignant cell colony.
Breast_Assessment_2
According to the 1998 Merck Manual, for every case of breast cancer diagnosed each year, five to ten women will needlessly undergo a painful breast biopsy. Statistically therefore each woman who undergoes annual screening mammograms for ten years has at least a fifty percent chance of undergoing a breast biopsy. Breast thermography has been researched for over forty years with a data base of over 1/4 million women. There are over 800 peer-reviewed thermographic studies. This research has concluded that a persistently abnormal themogram is consistent with a 22 fold increase in the risk of developing breast cancer. Because of the safety inherent in the test, thermography can be performed on an individual of any age, including those who are pregnant or breast feeding.
Thermography is unaffected by breast density, implants or scars from surgery. It allows for the avoidance of potentially harmful radiation, a known carcinogen. Radiation from routine mammograms poses significant cumulative risk of initiating and promoting breast cancer (1-3) . In fact a mammogram results in 1000 fold greater radiation exposure than a chest x-ray(2). Additionally each rad (radiation absorbed dose) of exposure increases breast cancer risk by one percent annually (4), an extremely worrisome statistic for premenopausal women whose breasts are more sensitive to radiation.
Breast thermography is non-contact test. Conversely, mammography involves placing the breast between two plates and subjecting the breast to painful compression. The recommended force to be used for the compression of breast tissue in a mammogram is 300 Newtons, the equivalent of placing a fifty pound weight on the breast. In an article written in 1928(5) physicians were warned to handle “cancerous breasts with care – for fear of accidentally disseminating cells and spreading cancer.” In 1992 (6) an opinion was offered that such compression might lead to distant and lethal spread of malignant cells by rupturing small blood vessels in or around small, as yet undetected breast cancers.
In 1995, the Lancet, a prestigious British medical journal, reported that “since mammographic screening was introduced in 1983, the incidence of ductal carcinoma in situ “DCIS”, which represents 12% of all breast cancer cases, has increased by 328% and 200% of this increase is due to the use of mammography.
Thermography has been determined to have an average sensitivity and specificity of 90% and when used as part of a comprehensive multi faceted approach can lead to early detection of 95% of early stage cancers. This increases the long term survival rate by as much as 60%.
BIBLIOGRAPHY:
(1-6) Cancer Prevention Coalition
Dangers And Unreliability of Mammography: Breast Examination is a safe, Effective, and Practical Alternative
Samuel S. Epstein, Rosalie Bertell, and Barbara Seanman
International Journal of Health Services, 31(3):605-615, 2001
Breast Thermography Article by Philip Getson, DO and Liesa Getson, CTT:
http://www.tdinj.com/docs/Breast-Thermography.pdf
Breast Thermography Technology
There are three different thermographic techniques for breast diagnosis: the tele-thermography, the contact thermography and the dynamic angiothermography. These digital infrared imaging thermographic techniques are based on the principle that metabolic activity and vascular circulation in both pre-cancerous tissue and the area surrounding a developing breast cancer is almost always higher than in normal breast tissue. Cancerous tumors require an ever-increasing supply of nutrients and therefore increase circulation to their cells by holding open existing blood vessels, opening dormant vessels, and creating new ones (neo-angiogenesis theory).
Tele-thermography and contact thermography supporters claim this process results in an increase in regional surface temperatures of the breast, however there is little evidence that thermography is an accurate means of identifying breast tumours. Thermography is not approved for breast cancer screening in the United States or Canada, and medical authorities have issued warnings against thermography in both countries.
Dynamic angiothermography utilizes thermal imaging but with important differences with the tele-thermography and contact thermography, that impact detection performance. First, the probes are improved over the previous liquid crystal plates; they include better spatial resolution, contrastive performance, and the image is formed more quickly. The more significant difference lies in identifying the thermal changes due to changes in vascular network to support the growth of the tumor/lesion. Instead of just recording the change in heat generated by the tumor, the image is now able to identify changes due to the vascularization of the mammary gland. It is currently used in combination with other techniques for diagnosis of breast cancer. This diagnostic method is a low cost one compared with other techniques. The angiothermography is not a test that substitutes for other tests, but stands in relation to them as a technique that gives additional information to clarify the clinical picture and improve the quality of diagnosis.
A Review of Breast Thermography
Note: The following is not a comprehensive review of the literature. Over 30 years of research compiling over 800 studies in the index-medicus exist. What follows is a pertinent sample review of the research concerning the clinical application of diagnostic infrared imaging (thermography) for use in breast cancer screening. All the citations are taken from the index-medicus peer-reviewed research literature or medical textbooks. The authors are either PhD’s with their doctorate in a representative field, or physicians primarily in the specialties of oncology, radiology, gynecology, and internal medicine.
The following list is a summary of the informational text that follows:
- In 1982, the FDA approved breast thermography as an adjunctive diagnostic breast cancer screening procedure.
- Breast thermography has undergone extensive research since the late 1950’s.
- Over 800 peer-reviewed studies on breast thermography exist in the index-medicus literature.
- In this database, well over 300,000 women have been included as study participants.
- The numbers of participants in many studies are very large — 10K, 37K, 60K, 85K…
- Some of these studies have followed patients up to 12 years.
- Strict standardized interpretation protocols have been established for over 15 years.
- Breast thermography has an average sensitivity and specificity of 90%.
- An abnormal thermogram is 10 times more significant as a future risk indicator for breast cancer than a first order family history of the disease.
- A persistent abnormal thermogram caries with it a 22x higher risk of future breast cancer.
- An abnormal infrared image is the single most important marker of high risk for developing breast cancer.
- Breast thermography has the ability to detect the first signs that a cancer may be forming up to 10 years before any other procedure can detect it.
- Extensive clinical trials have shown that breast thermography significantly augments the long-term survival rates of its recipients by as much as 61%.
- When used as part of a multimodal approach (clinical examination + mammography + thermography) 95% of early stage cancers will be detected.
Introduction
The first recorded use of thermobiological diagnostics can be found in the writings of Hippocrates around 480 B.C.[1]. A mud slurry spread over the patient was observed for areas that would dry first and was thought to indicate underlying organ pathology. Since this time, continued research and clinical observations proved that certain temperatures related to the human body were indeed indicative of normal and abnormal physiologic processes. In the 1950’s, military research into infrared monitoring systems for night time troop movements ushered in a new era in thermal diagnostics. The first use of diagnostic thermography came in 1957 when R. Lawson discovered that the skin temperature over a cancer in the breast was higher than that of normal tissue[2].
The Department of Health Education and Welfare released a position paper in 1972 in which the director, Thomas Tiernery, wrote, “The medical consultants indicate that thermography, in its present state of development, is beyond the experimental state as a diagnostic procedure in the following 4 areas: 1) Pathology of the female breast. 2)……”. On January 29, 1982, the Food and Drug Administration published its approval and classification of thermography as an adjunctive diagnostic screening procedure for the detection of breast cancer. Since the late 1970’s, numerous medical centers and independent clinics have used thermography for a variety of diagnostic purposes.
Fundamentals of Infrared Imaging
Physics – All objects with a temperature above absolute zero (-273 K) emit infrared radiation from their surface. The Stefan-Boltzmann Law defines the relation between radiated energy and temperature by stating that the total radiation emitted by an object is directly proportional to the object’s area and emissivity and the fourth power of its absolute temperature. Since the emissivity of human skin is extremely high (within 1% of that of a black body), measurements of infrared radiation emitted by the skin can be converted directly into accurate temperature values.
Equipment Considerations – Infrared rays are found in the electromagnetic spectrum within the wavelengths of 0.75 micron – 1mm. Human skin emits infrared radiation mainly in the 2 – 20 micron wavelength range, with an average peak at 9-10 microns[3]. State-of-the-art infrared radiation detection systems utilize ultra-sensitive infrared cameras and sophisticated computers to detect, analyze, and produce high-resolution diagnostic images of these infrared emissions. The problems encountered with first generation infrared camera systems such as improper detector sensitivity (low-band), thermal drift, calibration, analog interface, etc. have been solved for almost two decades.
Laboratory Considerations – Thermographic examinations must be performed in a controlled environment. The primary reason for this is the nature of human physiology. Changes from a different external (non-clinical controlled room) environment, clothing, etc. produce thermal artifacts. Refraining from sun exposure, stimulation or treatment of the breasts, and cosmetics and lotions before the exam, along with 15 minutes of nude acclimation in a florescent lit, draft and sunlight-free, temperature and humidity-controlled room maintained between 18-22 degree C, and kept to within 1 degree C of change during the examination, is necessary to produce a physiologically neutral image free from artifact.
Correlation Between Pathology and Infrared Imaging
The empirical evidence that underlying breast cancer alters regional skin surface temperatures was investigated early on. In 1963, Lawson and Chughtai, two McGill University surgeons, published an elegant intra-operative study demonstrating that the increase in regional skin surface temperature associated with breast cancer was related to venous convection[4]. This early quantitative experiment added credence to previous research suggesting that infrared findings were related to both increased vascular flow and increased metabolism.
Infrared imaging of the breast may have critical prognostic significance since it may correlate with a variety of pathologic prognostic features such as tumor size, tumor grade, lymph node status and markers of tumor growth[5]. The pathologic basis for these infrared findings, however, is uncertain. One possibility is increased blood flow due to vascular proliferation (assessed by quantifying the microvascular density (MVD)) as a result of tumor associated angiogenesis. Although in one study[6], the MVD did not correlate with abnormal infrared findings. However, the imaging method used in that study consisted of contact plate technology (liquid crystal thermography (LCT)), which is not capable of modern computerized infrared analysis. Consequently, LCT does not possess the discrimination and digital processing necessary to begin to correlate histological and discrete vascular changes[7].
In 1993, Head and Elliott reported that improved images from second generation infrared systems allowed more objective and quantitative analysis[5], and indicated that growth-rate related prognostic indicators were strongly associated with the infrared image interpretation.
In a 1994 detailed review of the potential of infrared imaging[8], Anbar suggested, using an elegant biochemical and immunological cascade, that the previous empirical observation that small tumors were capable of producing notable infrared changes could be due to enhanced perfusion over a substantial area of the breast surface via regional tumor induced nitric oxide vasodilatation. Nitric oxide is a molecule with potent vasodilating properties. It is synthesized by nitric oxide synthase (NOS), found both as a constitutive form of nitric oxide synthase (c-NOS), especially in endothelial cells, and as an inducible form of nitric oxide synthase (i-NOS), especially in macrophages[9]. NOS has been demonstrated in breast carcinoma[10] using tissue immunohistochemistry, and is associated with a high tumor grade. There have been, however, no previous studies correlating tissue NOS levels with infrared imaging. Given the correlation between infrared imaging and tumor grade, as well as NOS levels and tumor grade, it is possible that infrared findings may correlate with tumor NOS content. Future studies are planned to investigate these possible associations.
The concept of angiogenesis, as an integral part of early breast cancer, was emphasized in 1996 by Guido and Schnitt. Their observations suggested that it is an early event in the development of breast cancer and may occur before tumor cells acquire the ability to invade the surrounding stroma and even before there is morphologic evidence of an in-situ carcinoma[11]. Anti-angiogenesis therapy is now one of the most promising therapeutic strategies and has been found to be pivotal in the new paradigm for consideration of breast cancer development and treatment[12]. In 1996, in his highly reviewed textbook entitled Atlas of Mammography – New Early Signs in Breast Cancer, Gamagami studied angiogenesis by infrared imaging and reported that hypervascularity and hyperthermia could be shown in 86% of non-palpable breast cancers. He also noted that in 15% of these cases infrared imaging helped to detect cancers that were not visible on mammography[13].
The underlying principle by which thermography (infrared imaging) detects pre-cancerous growths and cancerous tumors surrounds the well documented recruitment of existing vascularity and neoangiogenesis which is necessary to maintain the increased metabolism of cellular growth and multiplication. The biomedical engineering evidence of thermography’s value, both in model in-vitro and clinically in-vivo studies of various tissue growths, normal and neoplastic, has been established[14-20].
The Role of Infrared Imaging in the Detection of Cancer
In order to evaluate the value of thermography, two viewpoints must be considered: first, the sensitivity of thermograms taken preoperatively in patients with known breast carcinoma, and second, the incidence of normal and abnormal thermograms in asymptomatic populations (specificity) and the presence or absence of carcinoma in each of these groups.
In 1965, Gershon-Cohen, a radiologist and researcher from the Albert Einstein Medical Center, introduced infrared imaging to the United States[21]. Using a Barnes thermograph, he reported on 4,000 cases with a sensitivity of 94% and a false-positive rate of 6%. This data was included in a review of the then current status of infrared imaging published in 1968 in CA – A Cancer Journal for Physicians[22].
In prospective studies, Hoffman first reported on thermography in a gynecologic practice. He detected 23 carcinomas in 1,924 patients (a detection rate of 12.5 per 1,000), with an 8.4% false-negative (91.6% sensitivity) and a 7.4% false-positive (92.6% specificity) rate[23].
Stark and Way screened 4,621 asymptomatic women, 35% of whom were under 35 years of age, and detected 24 cancers (detection rate of 7.6 per 1,000), with a sensitivity and specificity of 98.3% and 93.5% respectively[24].
In a mobile unit examination of rural Wisconsin, Hobbins screened 37,506 women using thermography. He reported the detection of 5.7 cancers per 1,000 women screened with a 12% false-negative and 14% false-positive rate. His findings also corroborated with others that thermography is the sole early initial signal in 10% of breast cancers[25-26].
Reporting his Radiology division’s experience with 10,000 thermographic studies done concomitantly with mammography over a 3 year period, Isard reiterated a number of important concepts including the remarkable thermal and vascular stability of the infrared image from year to year in the otherwise healthy patient and the importance of recognizing any significant change[27]. In his experience, combining these modalities increased the sensitivity rate of detection by approximately 10%; thus, underlining the complementarity of these procedures since each one did not always suspect the same lesion. It was Isard’s conclusion that, had there been a preliminary selection of his group of 4,393 asymptomatic patients by infrared imaging, mammographic examination would have been restricted to the 1,028 patients with abnormal infrared imaging, or 23% of this cohort. This would have resulted in a cancer detection rate of 24.1 per 1000 combined infrared and mammographic examinations as contrasted to the expected 7 per 1000 by mammographic screening alone. He concluded that since infrared imaging is an innocuous examination, it could be utilized to focus attention upon asymptomatic women who should be examined more intensely. Isard emphasized that, like mammography and other breast imaging techniques, infrared imaging does not diagnose cancer, but merely indicates the presence of an abnormality.
Spitalier and associates screened 61,000 women using thermography over a 10 year period. The false-negative and positive rate was found to be 11% (89% sensitivity and specificity). 91% of the nonpalpable cancers (T0 rating) were detected by thermography. Of all the patients with cancer, thermography alone was the first alarm in 60% of the cases. The authors also noted that “in patients having no clinical or radiographic suspicion of malignancy, a persistently abnormal breast thermogram represents the highest known risk factor for the future development of breast cancer”[28].
Two small-scale studies by Moskowitz (150 patients)[29] and Treatt (515 patients)[30] reported on the sensitivity and reliability of infrared imaging. Both used unknown “experts” to review the images of breast cancer patients. While Moskowitz excluded unreadable images, data from Threatt’s study indicated that less than 30% of the images produced were considered good, the rest being substandard. Both of these studies produced poor results; however, this could be expected from the fact alone that both used such a small patient base. However, the greatest error in these studies is found in the methods used to analyze the images. The type of image analysis consisted of the sole use of abnormal vascular pattern recognition. At the time these studies were performed, the most recognized method of infrared image analysis used a combination of abnormal vascular patterns with a quantitative analysis of temperature variations across the breasts. Consequently, the data obtained from these studies is highly questionable. Their findings were also inconsistent with numerous previous large-scale multi-center trials. The authors suggested that for infrared imaging to be truly effective as a screening tool, there needed to be a more objective means of interpretation and proposed that this would be facilitated by computerized evaluation. This statement is interesting considering that the use of recognized quantitative and qualitative reading protocols (including computer analysis) was available at the time.
In a unique study comprising 39,802 women screened over a 3 year period, Haberman and associates used thermography and physical examination to determine if mammography was recommended. They reported an 85% sensitivity and 70% specificity for thermography. Haberman cautioned that the findings of thermographic specificity could not be extrapolated from this study as it was well documented that long term observation (8-10 years or more) is necessary to determine a true false-positive rate. The authors noted that 30% of the cancers found would not have been detected if it were not for thermography[31].
Gros and Gautherie reported on 85,000 patients screened with a resultant 90% sensitivity and 88% specificity. In order to investigate a method of increasing the sensitivity of the test, 10,834 patients were examined with the addition of a cold-challenge (two types: fan and ice water) in order to elicit an autonomic response. This form of dynamic thermography decreased the false-positive rate to 3.5% (96.5% sensitivity)[32-35].
In a large scale multi-center review of nearly 70,000 women screened, Jones reported a false-negative and false-positive rate of 13% ( 87% sensitivity) and 15% (85% sensitivity) respectively for thermography[36].
In a study performed in 1986, Usuki reported on the relation of thermographic findings in breast cancer diagnosis. He noted an 88% sensitivity for thermography in the detection of breast cancers[37].
In a study comparing clinical examination, mammography, and thermography in the diagnosis of breast cancer, three groups of patients were used: 4,716 patients with confirmed carcinoma, 3,305 patients with histologically diagnosed benign breast disease, and 8,757 general patients (16,778 total participants). This paper also compared clinical examination and mammography to other well known studies in the literature including the NCI-sponsored Breast Cancer Detection Demonstration Projects. In this study, clinical examination had an average sensitivity of 75% in detecting all tumors and 50% in cancers less than 2 cm in size. This rate is exceptionally good when compared to many other studies at between 35-66% sensitivity. Mammography was found to have an average 80% sensitivity and 73% specificity. Thermography had an average sensitivity of 88% (85% in tumors less than 1 cm in size) and a specificity of 85%. An abnormal thermogram was found to have a 94% predictive value. From the findings in this study, the authors suggested that “none of the techniques available for screening for breast carcinoma and evaluating patients with breast related symptoms is sufficiently accurate to be used alone. For the best results, a multimodal approach should be used”[38].
In a series of 4,000 confirmed breast cancers, Thomassin and associates observed 130 sub-clinical carcinomas ranging in diameter of 3-5 mm. Both mammography and thermography were used alone and in combination. Of the 130 cancers, 10% were detected by mammography only, 50% by thermography alone, and 40% by both techniques. Thus, there was a thermal alarm in 90% of the patients and the only sign in 50% of the cases[39].
In a study by Gautherie and associates, the effectiveness of thermography in terms of survival benefit was discussed. The authors analyzed the survival rates of 106 patients in whom the diagnosis of breast cancer was established as a result of the follow-up of thermographic abnormalities found on the initial examination when the breasts were apparently healthy (negative physical and mammographic findings). The control group consisted of 372 breast cancer patients. The patients in both groups were subjected to identical treatment and followed for 5 years. A 61% increase in survival was noted in the patients who were followed-up due to initial thermographic abnormalities. The authors summarized the study by stating that “the findings clearly establish that the early identification of women at high risk of breast cancer based on the objective thermal assessment of breast health results in a dramatic survival benefit”[40-41].
In a simple review of over 15 studies from 1967–1998, breast thermography has showed an average sensitivity and specificity of 90%. With continued technological advances in infrared imaging in the past decade, some studies are showing even higher sensitivity and specificity values. However, until further large scale studies are performed, these findings remain in question.
Breast Cancer Detection and Demonstration Projects
The Breast Cancer Detection and Demonstration Project (BCDDP) is the most frequently quoted reason for the decreased use of infrared imaging. The BCDDP was a large-scale study performed from 1973 through 1979 which collected data from many centers around the United States. Three methods of breast cancer detection were studied: physical examination, mammography, and infrared imaging (breast thermography).
Inflated Expectations – Just before the onset of the BCDDP, two important papers appeared in the literature. In 1972, Gerald D. Dodd of the University of Texas Department of Diagnostic Radiology presented an update on infrared imaging in breast cancer diagnosis at the 7th National Cancer Conference sponsored by the National Cancer Society and the National Cancer Institute[42]. In his presentation, he suggested that infrared imaging would be best employed as a screening agent for mammography. He proposed that in any general survey of the female population age 40 and over, 15 to 20% of these subjects would have positive infrared imaging and would require mammograms. Of these, approximately 5% would be recommended for biopsy. He concluded that infrared imaging would serve to eliminate 80 to 85% of the potential mammograms. Dodd also reiterated that the procedure was not competitive with mammography and, reporting the Texas Medical School’s experience with infrared imaging, noted that it was capable of detecting approximately 85% of all breast cancers. Dodd’s ideas would later help to fuel the premise and attitudes incorporated into the BCDDP. Three years later, J.D. Wallace presented to another Cancer Conference, sponsored by the American College of Radiology, the American Cancer Society and the Cancer Control Program of the National Cancer Institute, an update on infrared imaging of the breast[43]. The author’s analysis suggested that the incidence of breast cancer detection per 1000 patients screened could increase from 2.72 when using mammography to 19 when using infrared imaging. He then underlined that infrared imaging poses no radiation burden on the patient, requires no physical contact and, being an innocuous technique, could concentrate the sought population by a significant factor selecting those patients that required further investigation. He concluded that, “the resulting infrared image contains only a small amount of information as compared to the mammogram, so that the reading of the infrared image is a substantially simpler task”.
Faulty Premise – Unfortunately, this rather simplistic and cavalier attitude toward the generation and interpretation of infrared imaging was prevalent when it was hastily added and then prematurely dismissed from the BCDDP which was just getting underway. Exaggerated expectations led to the ill-founded premise that infrared imaging might replace mammography rather than complement it. A detailed review of the Report of the Working Group of the BCDDP, published in 1979, is essential to understand the subsequent evolution of infrared imaging[44]. The work scope of this project was issued by the NCI on the 26th of March 1973 with six objectives, the second being to determine if a negative infrared image was sufficient to preclude the use of clinical examination and mammography in the detection of breast cancer. The Working Group, reporting on results of the first four years of this project, gave a short history regarding infrared imaging in breast cancer detection. They wrote that as of the sixties, there was intense interest in determining the suitability of infrared imaging for large-scale applications, and mass screening was one possibility. The need for technological improvement was recognized and the authors stated that efforts had been made to refine the technique. One of the important objectives behind these efforts had been to achieve a sufficiently high sensitivity and specificity for infrared imaging under screening conditions to make it useful as a pre-screening device in selecting patients for referral for mammographic examination. It was thought that if successful, this technology would result in a relatively small proportion of women having mammography (a technique that had caused concern at that time because of the carcinogenic effects of radiation). The Working Group indicated that the sensitivity and specificity of infrared imaging readings, with clinical data emanating from inter-institutional studies, were close to the corresponding results for physical examination and mammography. They noted that these three modalities selected different sub-groups of breast cancers, and for this reason further evaluation of infrared imaging as a screening device in a controlled clinical trial was recommended.
Poor Study Design – While this report describes in detail the importance of quality control of mammography, the entire protocol for infrared imaging was summarized in one paragraph and simply indicated that infrared imaging was conducted by a BCDDP trained technician. The detailed extensive results from this report, consisting of over 50 tables, included only one that referred to infrared imaging showing that it had detected only 41% of the breast cancers during the first screening while the residual were either normal or unknown. There is no breakdown as far as these two latter groups were concerned. Since 28% of the first screening and 32% of the second screening were picked up by mammography alone, infrared imaging was dropped from any further evaluation and consideration. The report stated that it was impossible to determine whether abnormal infrared imaging could be predictive of interval cancers (cancers developing between screenings) since they did not collect this data. By the same token, the Working Group was unable to conclude, with their limited experience, whether the findings were related to the then available technology of infrared imaging or with its application. They did, however, conclude that the decision to dismiss infrared imaging should not be taken as a determination of the future of this technique, rather that the procedure continued to be of interest because it does not entail the risk of radiation exposure. In the Working Group’s final recommendation, they state that “infrared imaging does not appear to be suitable as a substitute for mammography for routine screening in the BCDDP.” The report admitted that several individual programs of the BCDDP had results that were more favorable than what was reported for the BCDDP as a whole. They encouraged investment in the development and testing of infrared imaging under carefully controlled study conditions and suggested that high priority be given to these studies. They noted that a few suitable sites appeared to be available within the BCDDP participants and proposed that developmental studies should be solicited from sites with sufficient experience.
Untrained Personnel and Protocol Violations – JoAnn Haberman, who was a participant in this project[45], provided further insight into the relatively simplistic regard assigned to infrared imaging during this program. The author reiterated that expertise in mammography was an absolute requirement for the awarding of a contract to establish a Screening Center. However, the situation was just the opposite with regard to infrared imaging – no experience was required at all. When the 27 demonstration project centers opened their doors, only 5 had any pre-existing expertise in infrared imaging. Of the remaining screening centers, there was no experience at all in this technology. Finally, more than 18 months after the project had begun, the NCI established centers where radiologists and their technicians could obtain sufficient training in infrared imaging. Unfortunately, only 11 of the demonstration project directors considered this training of sufficient importance to send their technologists to learn proper infrared technique. The imaging sites also disregarded environmental controls. Many of the project sites were mobile imaging vans which had poor heating and cooling capabilities and often kept their doors open in the front and rear to permit an easy flow of patients. This, combined with a lack of pre-imaging patient acclimation, lead to unreadable images.
In summary, with regard to thermography, the BCDDP was plagued with problems and seriously flawed in four critical areas: 1) Completely untrained technicians were used to perform the scans, 2) The study used radiologists who had no experience or knowledge in reading infrared images, 3) Proper laboratory environmental controls were completely ignored. In fact, many of the research sites were mobile trailers with extreme variations in internal temperatures, 4) No standardized reading protocol had yet been established for infrared imaging. The BCDDP was also initiated with an incorrect premise that thermography might replace mammography. From a purely scientific point, an anatomical imaging procedure (mammography) cannot be replaced by a physiological one. Last of all, and of considerable concern, was the reading of the images. It wasn’t until the early 1980’s that established and standardized reading protocols were introduced. Considering these facts, the BCDDP could not have properly evaluated infrared imaging. With the advent of known laboratory environmental controls, established reading protocols, and state-of-the-art infrared technology, a poorly performed 20-year-old study cannot be used to determine the appropriateness of thermography.
Thermography as a Risk Indicator
As early as 1976, at the Third International Symposium on Detection and Prevention of Cancer in New York, thermography was established by consensus as the highest risk marker for the possibility of the presence of an undetected breast cancer. It had also been shown to predict such a subsequent occurrence[46-48]. The Wisconsin Breast Cancer Detection Foundation presented a summary of its findings in this area, which has remained undisputed[49]. This, combined with other reports, has confirmed that thermography is the highest risk indicator for the future development of breast cancer and is 10 times as significant as a first order family history of the disease[50].
In a study of 10,000 women screened, Gautherie found that, when applied to asymptomatic women, thermography was very useful in assessing the risk of cancer by dividing patients into low- and high-risk categories. This was based on an objective evaluation of each patient’s thermograms using an improved reading protocol that incorporated 20 thermopathological factors[51].
From a patient base of 58,000 women screened with thermography, Gros and associates followed 1,527 patients with initially healthy breasts and abnormal thermograms for 12 years. Of this group, 40% developed malignancies within 5 years. The study concluded that “an abnormal thermogram is the single most important marker of high risk for the future development of breast cancer”[35].
Spitalier and associates followed 1,416 patients with isolated abnormal breast thermograms. It was found that a persistently abnormal thermogram, as an isolated phenomenon, is associated with an actuarial breast cancer risk of 26% at 5 years. Within this study, 165 patients with non-palpable cancers were observed. In 53% of these patients, thermography was the only test which was positive at the time of initial evaluation. It was concluded that: 1) A persistently abnormal thermogram, even in the absence of any other sign of malignancy, is associated with a high risk of developing cancer, 2) This isolated abnormal also carries with it a high risk of developing interval cancer, and as such the patient should be examined more frequently than the customary 12 months, 3) Most patients diagnosed as having minimal breast cancer have abnormal thermograms as the first warning sign[52-53].
Current Status of Detection
Current first-line breast cancer detection strategy still depends essentially on clinical examination and mammography. The limitations of the former, with its reported sensitivity rate often below 65%[54] is well-recognized, and even the proposed value of self-breast examination is now being contested[55]. While mammography is accepted as the most reliable and cost-effective imaging modality, its contribution continues to be challenged with persistent false-negative rates ranging up to 30% [56-57]; with decreasing sensitivity in patients on estrogen replacement therapy[58]. In addition, there is recent data suggesting that denser and less informative mammography images are precisely those associated with an increased cancer risk[59]. Echoing some of the shortcomings of the BCDDP concerning their study design and infrared imaging, Moskowitz indicated that mammography is also not a procedure to be performed by the untutored[60].
With the current emphasis on earlier detection, there is now renewed interest in the parallel development of complimentary imaging techniques that can also exploit the precocious metabolic, immunological and vascular changes associated with early tumor growth. While promising, techniques such as scintimammography[61], doppler ultrasound[62], and MRI[63], are associated with a number of disadvantages that include exam duration, limited accessibility, need of intravenous access, patient discomfort, restricted imaging area, difficult interpretation and limited availability of the technology. Like ultrasound, they are more suited to use as second-line options to pursue the already abnormal clinical or mammographic evaluation. While practical, this step-wise approach currently results in the non-recognition, and thus delayed utilization of second-line technology in approximately 10% of established breast cancers[60]. This is consistent with study published by Keyserlingk et al[64].
Because of thermography’s unique ability to image the thermovascular aspects of the breast, extremely early warning signals (from 8-10 years before any other detection method) have been observed in long-term studies. Consequently, thermography is the earliest known indicator for the future development of breast cancer. It is for this reason that an abnormal infrared image is the single most important marker of high risk for developing breast cancer. Thus, thermography has a significant place as one of the major front-line methods of breast cancer detection.
Conclusion
The large patient populations and long survey periods in many of the above clinical studies yields a high significance to the various statistical data obtained. This is especially true for the contribution of thermography to early cancer diagnosis, as an invaluable marker of high-risk populations, and therapeutic decision making (a contribution that has been established and justified by the unequivocal relationship between heat production and tumor doubling time).
Currently available high-resolution digital infrared imaging (Thermography) technology benefits greatly from enhanced image production, standardized image interpretation protocols, computerized comparison and storage, and sophisticated image enhancement and analysis. Over 30 years of research and 800 peer-reviewed studies encompassing well over 300,000 women participants has demonstrated thermography’s abilities in the early detection of breast cancer. Ongoing research into the thermal characteristics of breast pathologies will continue to investigate the relationships between neoangiogenesis, chemical mediators, and the neoplastic process.
It is unfortunate, but many physicians still hesitate to consider thermography as a useful tool in clinical practice in spite of the considerable research database, continued improvements in both thermographic technology and image analysis, and continued efforts on the part of the thermographic societies. This attitude may be due to the fact that the physical and biological bases of thermography are not familiar to most physicians. The other methods of cancer investigations refer directly to topics of medical teaching. For instance, radiography and ultrasonography refer to anatomy. Thermography, however, is based on thermodynamics and thermokinetics, which are unfamiliar to most physicians, though man is experiencing heat production and exchange in every situation he undergoes or creates.
Considering the contribution that thermography has demonstrated thus far in the field of early cancer detection, all possibilities should be considered for promoting further technical, biological, and clinical research in this procedure.
REFERENCES
[1] Adams, F.: The Genuine Works of Hippocrates. Baltimore: Williams and Wilkins, 1939. [2] Lawson R.: Implications of Surface Temperatures in the Diagnosis of Breast Cancer. Can Med Assoc J 75: 309-310,1956.
[3] Archer, F., Gros, C.: Classification Thermographique des Cancers Mammaries. Bull Cancer 58:351-362, 1971 [4] Lawson RN and Chughtai MS: Breast cancer and body temperatures. Can Med Assoc J 88: 68-70,1963.
[5] Head JF, Wang F, Elliott RL: Breast thermography is a noninvasive prognostic procedure that predicts tumor growth rate in breast cancer patients. Ann N Y Acad Sci 698:153-158,1993.
[6] Sterns EE, Zee B, Sen Gupta J, and Saunders FW. Thermography: Its relation to pathologic characteristics, vascularity, proliferative rate and survival of patients with invasive ductal carcinoma of the breast. Cancer 77:1324-8, 1996.
[7] Head JF, Elliott RL: Breast Thermography. Cancer 79:186-8,1995.
[8] Anbar M: Breast Cancer. In: Quantitative Dynamic Telethermometry in Medical Diagnosis and Management. CRC Press, Ann Arbor, Mich, pp.84-94, 1994.
[9] Rodenberg DA, Chaet MS, Bass RC, Arkovitz MD and Garcia BF. Nitric Oxide: An overview. Am J Surg 170:292-303,1995.
[10] Thomsen LL, Miles DW, Happerfield L, Bobrow LG, Knowles RG and Mancada S. Nitric oxide synthase activity in human breast cancer. Br J Cancer 72(1);41-4,July 1995.
[11] Guidi AJ, Schnitt SJ: Angiogenesis in pre-invasive lesions of the breast. The Breast J (2): 364-369, 1996.
[12] Love SM, Barsky SH: Breast Cancer: An interactive Paradigm. Breast J 3: 171-5,1996.
[13] Gamagami P: Indirect signs of breast cancer: Angiogenesis study. In: Atlas of Mammography, Cambridge, Mass.,Blackwell Science pp.231-26, 1996.
[14] Love, T.: Thermography as an Indicator of Blood Perfusion. Proc NY Acad Sci J 335:429-437,1980.
[15] Chato, J.: Measurement of Thermal Properties of Growing Tumors. Proc NY Acad Sci 335:67-85,1980.
[16] Draper, J. : Skin Temperature Distribution Over Veins and Tumors. Phys Med Biol 16(4):645-654,1971
[17] Jain, R.; Gullino, P.: Thermal Characteristics of Tumors: Applications in Detection and Treatment. Ann NY Acad Sci 335:1-21,1980
[18] Gautherie, M.: Thermopathology of Breast Cancer; Measurement and Analysis of In-Vivo Temperature and Blood Flow. Ann NY Acad Sci 365:383, 1980
[19] Gautherie, M.: Thermobiological Assessment of Benign and Malignant Breast Diseases. Am J Obstet Gynecol (8)147:861-869, 1983
[20] Gamigami, P.: Atlas of Mammography: New Early Signs in Breast Cancer. Blackwell Science, 1996. [21] Gershen-Cohen J, Haberman J, Brueschke EE: Medical thermography: A summary of current status. Radiol Clin North Am 3:403-431, 1965.
[22] Haberman J: The present status of mammary thermography. In: Ca – A Cancer Journal for Clinicians 18: 314-321,1968.
[23] Hoffman, R.: Thermography in the Detection of Breast Malignancy. Am J Obstet Gynecol 98:681-686, 1967
[24] Stark, A., Way, S.: The Screening of Well Women for the Early Detection of Breast Cancer Using Clinical Examination with Thermography and Mammography. Cancer 33:1671-1679, 1974
[25] Hobbins, W.: Mass Breast Cancer Screening. Proceedings, Third International Symposium on Detection and Prevention of Breast Cancer, New York City, NY: pg. 637, 1976.
[26] Hobbins, W.: Abnormal Thermogram — Significance in Breast Cancer. RIR 12: 337-343, 1987 [27] Isard HJ, Becker W, Shilo R et al: Breast thermography after four years and 10,000 studies. Am J Roentgenol 115: 811-821,1972.
[28] Spitalier, H., Giraud, D., et al: Does Infrared Thermography Truly Have a Role in Present-Day Breast Cancer Management? Biomedical Thermology, Alan R. Liss New York, NY. pp. 269-278, 1982 [29] Moskowitz M, Milbrath J, Gartside P et al: Lack of efficacy of thermography as a screening tool for minimal and Stage I Breast Cancer. N Engl J Med 295; 249-252,1976.
[30] Threatt B, Norbeck JM, Ullman NS, et al: Thermography and breast cancer: an analysis of a blind reading. Annals N Y Acad Sci 335: 501-519,1980.
[31] Haberman, J., Francis, J., Love, T.: Screening a Rural Population for Breast Cancer Using Thermography and Physical Examination Techniques. Ann NY Acad Sci 335:492-500,1980
[32] Sciarra, J.: Breast Cancer: Strategies for Early Detection. Thermal Assessment of Breast Health. (Proceedings of the International Conference on Thermal Assessment of Breast Health). MTP Press LTD. pp. 117-129, 1983.
[33] Gautherie, M.: Thermobiological Assessment of Benign and Malignant Breast Diseases. Am J Obstet Gynecol (8)147:861-869, 1983.
[34] Louis, K., Walter, J., Gautherie, M.: Long-Term Assessment of Breast Cancer Risk by Thermal Imaging. Biomedical Thermology. Alan R. Liss Inc. pp.279-301, 1982.
[35] Gros, C., Gautherie, M.: Breast Thermography and Cancer Risk Prediction. Cancer 45:51-56, 1980 [36] Jones CH: Thermography of the Female Breast. In: C.A. Parsons (Ed) Diagnosis of Breast Disease, University Park Press, Baltimore, pp. 214-234,1983.
[37] Useki H: Evaluation of the thermographic diagnosis of breast disease: relation of thermographic findings and pathologic findings of cancer growth. Nippon Gan Chiryo Gakkai Shi 23: 2687-2695, 1988.
[38] Nyirjesy, I., Ayme, Y., et al: Clinical Evaluation, Mammography, and Thermography in the Diagnosis of Breast Carcinoma. Thermology 1:170-173, 1986
[39] Thomassin, L., Giraud, D. et al: Detection of Subclinical Breast Cancers by Infrared Thermography. Recent Advances in Medical Thermology (Proceedings of the Third International Congress of Thermology), Plenum Press, New York, NY. pp.575-579, 1984
[40] Gautherie, M., et al: Thermobiological Assessment of Benign and Malignant Breast Diseases. Am J Obstet Gynecol (8)147:861-869, 1983.
[41] Jay, E.; Karpman, H.: Computerized Breast Thermography. Thermal Assessment of Breast Health (Proceedings of an International Conference), MTP Press Ltd., pp.98-109, 1983 [42] Dodd GD: Thermography in Breast Cancer Diagnosis. In: Abstracts for the Seventh National Cancer Conference Proceedings. Los Angeles, Calif., Sept. 27-29, Lippincott Philadelphia, Toronto: pp.267,1972.
[43] Wallace JD: Thermographic examination of the breast: An assessment of its present capabilities. In: Gallagher HS (Ed): Early Breast Cancer: Detection and Treatment. American College of Radiology, Wiley, New York: Wiley, pp. 13-19,1975.
[44] Report of the Working Group to Review the National Cancer Institute Breast Cancer Detection Demonstration Projects. J Natl Cancer Inst 62: 641-709,1979.
[45] Haberman J: An overview of breast thermography in the United States: In: Margaret Abernathy, Sumio Uematsu (Eds): Medical Thermography. American Academy of Thermology, Washington, pp.218-223, 1986.
[46] Amalric, R., Gautherie, M., Hobbins, W., Stark, A.: The Future of Women with an Isolated Abnormal Infrared Thermogram. La Nouvelle Presse Med 10(38):3153-3159, 1981
[47] Gautherie, M., Gros, C.: Contribution of Infrared Thermography to Early Diagnosis, Pretherapeutic Prognosis, and Post-irradiation Follow-up of Breast Carcinomas. Laboratory of Electroradiology, Faculty of Medicine, Louis Pasteur University, Strasbourg, France, 1976
[48] Hobbins, W.: Significance of an “Isolated” Abnormal Thermogram. La Nouvelle Presse Medicale 10(38):3153-3155, 1981
[49] Hobbins, W.: Thermography, Highest Risk Marker in Breast Cancer. Proceedings of the Gynecological Society for the Study of Breast Disease. pp. 267-282, 1977.
[50] Louis, K., Walter, J., Gautherie, M.: Long-Term Assessment of Breast Cancer Risk by Thermal Imaging. Biomedical Thermology. Alan R. Liss Inc. pp.279-301, 1982.
[51] Gauthrie, M.: Improved System for the Objective Evaluation of Breast Thermograms. Biomedical Thermology; Alan R. Liss, Inc., New York, NY; pp.897-905, 1982
[52] Amalric, R., Giraud, D., et al: Combined Diagnosis of Small Breast Cancer. Acta Thermographica, 1984.
[53] Spitalier, J., Amalric, D., et al: The Importance of Infrared Thermography in the Early Suspicion and Detection of Minimal Breast Cancer. Thermal Assessment of Breast Health (Proceedings of an International Conference), MTP Press Ltd., pp.173-179, 1983
[54] Sickles EA: Mammographic features of “early” breast cancer. Am J Roentgenol 143:461, 1984. [55] Thomas DB, Gao DL, Self SG et al: Randomized trial of breast self-examination in Shanghai: Methodology and Preliminary Results. J Natl Cancer Inst 5:355-65, 1997.
[56] Moskowitz M: Screening for breast cancer. How effective are our tests? CA Cancer J Clin 33:26,1983.
[57] Elmore JG, Wells CF, Carol MPH et al. Variability in radiologists interpretation of mammograms. NEJM 331(22):1994;1493
[58] Laya MB: Effect on estrogen replacement therapy on the specificity and sensitivity of screening mammography. J Natl Cancer Inst 88:643-649, 1996.
[59] Boyd NF, Byng JW, Jong RA et al: Quantitative classification of mammographic densities and breast cancer risk. J Natl Cancer Inst 87:670-75,1995.
[60] Moskowitz M: Breast Imaging. In: Donegan WL, Spratt JS (Eds): Cancer of the breast. Saunders, New York, pp.206-239, 1995.
[61] Khalkhali I, Cutrone JA et al: Scintimammography: the complementary role of Tc-99m sestamibi prone breast imaging for the diagnosis of breast carcinoma. Radiol 196: 421-426, 1995.
[62] Kedar RP, Cosgrove DO et al: Breast carcinoma: measurement of tumor response in primary medical therapy with color doppler flow imaging. Radiol 190: 825-830, 1994. [63] Weinreb JC, Newstead G: MR imaging of the breast. Radiol 196: 593-610, 1995.
[64] Keyserlingk JR, Ahlgren, PD, Yu E and Belliveau N: Infrared imaging of the breast: Initial reappraisal using high-resolution digital technology in 100 successive cases of Stage I and II breast cancer. The Breast Journal (4):245-251,1998.
William C. Amalu, DC, DIACT (B), FIACT
© 2002 International Academy of Clinical Thermography
NeuroMusculoSkeletal Thermography
Neuromuscular Thermography
The following are uses of neuromuscular thermography when anatomic tests (CT, myelogram and/or MRI) have not been performed, or are negative or inconclusive:
- To evaluate sensory/autonomic peripheral nerve injury
- To evaluate for the possibility of Reflex Sympathetic Dystrophy/Complex Regional Pain Syndrome or other autonomic dystrophy and to monitor the treatment of same.
- To evaluate and monitor myofascial injury.
- Differentiate, document, and monitor any neuromuscular injury that does not respond to clinical treatment.
- To identify occult myofascial conditions versus symptom magnification.
- To evaluate facial or temporomandibular joint pain when other tests are unrevealing. If the tests of neurophysiology (thermogram and EMG) have been done first, and are negative, the need for anatomic testing may be reconsidered.
The following are uses of neuromuscular thermography when anatomic tests (CT, Myelogram, and/or MRI) have been performed and are positive:
- To evaluate the significance of positive findings when the physical exam or history do not coincide, i.e., a lesion may be present anatomically, but have no significance physiologically.
- To look for hidden or missed lesions. Examples:
- The CT may be abnormal at one level, but the thermogram may show abnormality at this and an adjacent level, leading the physician to order another test, such as a myelogram or MRI, which may uncover a second lesion.
- The patient may have nerve dysfunction and Reflex Sympathetic Dystrophy/Complex Regional Pain Syndrome, with only one set of presenting symptoms.
- The patient may have both nerve problems (disc), and trigger points or facet joint problems, with overlapping or masking of symptoms. Under these circumstances, history and/or symptoms can be masked by the predominant lesion.
- To evaluate the significance of equivocal or mild disc bulges or herniations on myelograms, CT or MRI scans if clinically indicated.
- To evaluate for the possibility of Reflex Sympathetic Dystrophy/Complex Regional Pain Syndrome, and to monitor treatment of same if clinically indicated.
- Differentiate, document, and monitor any neuromuscular injury that does not respond to clinical treatment.
Pain Evaluation
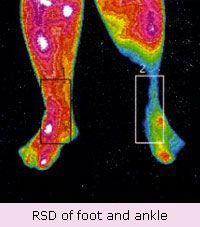
Chronic pain and its cause is one of the most difficult diagnostic problems plaguing physicians today. Frequently patient’s tests do not correlate with their symptoms. Individuals with radicular symptomatology may have more than one etiology for their problem. The combined use of anatomic and physiologic testing has long been common in the medical community. However until now the physiologic test of choice has been electromyography (EMG) which studies the motor function of nerve and not its sensory component.
Thermography is a physiologic test (rather than an anatomic one) that measures the autonomic nervous system. While other physiologic tests exist they do not monitor the pathways in the same fashion as thermography. It is my opinion that thermography is the BEST diagnostic tool for the evaluation of individuals suspected of having Reflex Sympathetic Dystrophy/Complex Regional Pain Syndrome (RSD/CRPS). In addition to the discomfort inherent in EMG’s the inability of the study to provide adequate information in many cases leads to an incomplete diagnosis. Utilizing non-invasive (and therefore not painful) thermal imaging even more information is available to assist us in the treatment of these individuals. Additionally thermal imaging can be used to monitor the effectiveness of various interventional pain management techniques by using a safe, highly reproducible, sensitive, and accurate diagnostic tool This includes the use of thermal imaging in the positioning of spinal cord stimulators which has increased the accuracy of lead placement. Thermography can detect alterations in the heat patterns of limbs to suggest that there are damaged leads thereby differentiating between an increased pain state and an equipment malfunction. Localization of trigger points by thermographic means has been shown to increase the effectiveness of injections into these areas.
pain_2
A study currently in progress suggests that Thermography can predict the spread of RSD before it actually occurs, thereby allowing for the earliest possible intervention.
Thoracic outlet syndrome can be demonstrated in real time or by static images using our thermographic apparatus.
The Use of Thermography in the Diagnosis of CRPS
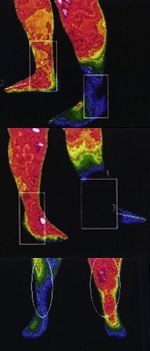
A Physician’s Opinion
By Philip Getson, DO
This article appeared in the Pain Practitioner, The Journal of The American Academy of Pain Management, Vol. 16, No. 1, 2006
CPRS
Experts who evaluate patients with CRPS [Complex Regional Pain Syndrome] make the diagnosis based upon history and physical examination. However, because of the wide variation in symptom complexes, not every individual presents with the “classic” symptoms that are frequently associated with CRPS (e.g., temperature change, color change, and hair growth change).
In the past, attempts have been made to diagnosis CRPS with triple phase bone scans. Some literature suggests that these are about 40% accurate, but I believe that in reality the number is closer to 15%. This test is frequently non-specific in its representation, and rarely do radiologists offer a diagnosis of CRPS when they have not been provided with that historical information. Electrodiagnostic testing (EMGs), CAT Scans, MRIs, etc., have no appreciable value in assisting in the diagnosis of CRPS.
Thermography has been utilized in medical application since the 1950s. Prior to that it had, and still does have, industrial applications. The use of infrared imaging for neuromuscular purposes dates back to the 1960’s and has continued despite lack of widespread acceptance. Numerous articles have been written regarding the value of thermography in the diagnosis of sympathetically mediated pain syndromes and work in this area continues. The July 2002 United States Department of Health and Human Services document on Reflex Sympathetic Dystrophy/Complex Regional Pain Syndromee, suggests thermography as the diagnostic tool for the evaluation of CRPS.
In the 24 years since I began using neuromuscular thermography in my practice, we have examined thousands of patients with neuromuscular disorders. Using electronic thermographic apparatus, the cameras (which were initially driven by liquid nitrogen) are now hi-tech computer-generated images that allow us to view the nervous system by measuring changes in skin temperature. These changes are controlled by the sympathetic nervous system and alterations in the sympathetics cause alterations in thermal (infrared) imaging which do not conform to dermatomal patterns.
While electrodiagnostic testing may show a radiculopathic pattern, such testing often errs because EMGs measure motor function as opposed to sensory function, which is the fundamental basis for CRPS. The mechanism of thermal imaging allows for perception of altered skin temperature to one-tenth of one degree centigrade. The lack of symmetry which is out of conformation to dermatomal distribution patterns goes a long way to confirming the clinical diagnosis of CRPS.
Measurements taken on an individual within approximately the first six months of the onset of the pathology will show the affected side to be warmer than the contra lateral side by temperature gradient in excess of 0.9 degrees centigrade (considered by this observer to be the standard for sympathetically mediated thermal asymmetry). Frequently this asymmetry exceeds 1.5 or 2 degrees and is clearly not the result of vascular pathology per se. After approximately six months the pattern changes with the affected side being the “cold side.” It is therefore imperative that a history of the traumatic event which precipitated CRPS be afforded the thermographic expert.
As can be seen from the images (included with this article), the temperature differential is often dramatic. While the human hand is capable of perceiving significant temperature differential between two sides, the thermal imaging camera is hundreds of times more sensitive and the temperature scale (unlike the human hand) and can be adjusted to incorporate variations in room and human body temperature, which varies from individual to individual. Additionally, this author is currently collecting data that clearly indicates that the migratory pattern of CRPS can be documented as much as six to nine months prior to the occurrence of symptomatology in a limb that has been affected with sympathetically-mediated dysfunction, but has not yet become symptomatic at the time the images were performed. It is fascinating to see patients who offer verbal complaints (in completed schematic diagram) about one limb, yet manifest thermal abnormalities in an entirely separate area. (See attached images).
In addition to the benefits in diagnosing sympathetically mediated pain syndromes, new thermographic cameras have the potential to offer real-time imaging capabilities that could allow monitoring of an affected limb during the surgical implantation of a spinal cord stimulator. By stimulating the affected nerve (thereby causing a “warming” of the damaged limb), the surgeon could place the leads accurately and “know” they were in the exact place to afford the individual the maximum benefit to be derived from such implantation. This would reduce the randomization factor currently in place by allowing for an electronic “road map” which otherwise does not exist. Similar use of thermal imaging for surgical or chemical ablations of sympathetic nerve dysfunction is possible.
In conclusion, thermographic (infrared) imaging appears to be the best, if not only diagnostic tool, that should be utilized by the clinician for objectification of a clinical diagnosis of sympathetically mediated pain syndromes. The overused adage, “A picture is worth 1000 words” is particularly applicable here, not only to assist the clinician in making the diagnosis, but to add verification to the patients’ symptoms, particularly in instances where they have been led to believe they are “crazy” because conventional diagnostic testing does not offer objective evidence of their symptom complex.
Research on thermographic imaging is on-going, bur as a diagnostic tool, much of its potential remains untapped. The number of people who have benefited from the conclusive diagnosis of CRPS by thermographic means continues to grow, thereby allowing clinicians an opportunity for earlier intervention of treatment to an affected body part.
Weather Sensitive Pain (Sympathetic Galvanic Skin Studies)
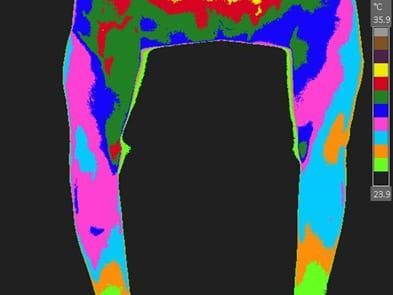
Thermography-Musculskeletal Sympathetic Skin Response Studies
Medical Thermography For Weather-Sensitive Pain (Sympathetic Galvonic Skin Studies)
Medical Thermography for weather-sensitive pain is a sensitive, objective test that utilizes an electronic infrared imaging device to measure the body’s skin temperature (sympathetic galvonic skin response). The procedure is harmless, non-invasive, and does not use ionizing radiation.
While safeguards are built into the test to assure that the findings are both consistent and reproducible over time, there are several “Do’s and “Don’ts” for the procedure that can help minimize those things that can inappropriately impact the outcome.
Don’t sunbathe or use a tanning bed for 48 hours prior to the exam.
Do not have an EMG/ Nerve Conduction study, use a Tens unit, have physical therapy or an acupuncture treatment prior to the exam.
Do shower and keep your skin clean of any ointments or lotion prior to the exam.
Infrared Thermographic Image
Because skin temperature is controlled by the “Sympathetic” portion of the nervous system, if there is a temperature difference greater than or equal to one degree centigrade from one side of the body to the other, then there is dysfunction of the sympathetic system. Most, but not all, sympathetic dysfunction syndromes are painful. If the pain becomes progressive and severe, it is referred to as RSD (reflex sympathetic dystrophy).
While there are many disorders that can lead to altered skin temperature, thermography is really the only way to measure large regions of skin temperature while simultaneously mapping the distribution of asymmetry. In order for the procedure to be clinically useful, a physician trained in the differential diagnosis of disorders that create thermographic abnormalities must interpret it.
For example, a patient with neck and arm pain presents with abnormally persistent, weather-sensitive pain. Other studies have not helped formulate a treatment program that provides relief. A thermographic study was done and showed changes in the entire limb, tracking on the inside, medial portion of the arm and forearm. To make use of the findings, the treating doctor must know that such an abnormality can occur with a strained ligament in the wrist, thoracic outlet syndrome, or a “C” fiber mediated nerve root irritation from a cervical facet or disk in the neck.
Once the presence of abnormality is discovered, treatment emphasis may very well shift from a pain management approach alone to one that also emphasizes improved circulation and reduction of those factors that inhibit normal nerve and vascular function.
Traditionally the prognosis for the resolution of symptoms with sympathetic pain syndromes is poor. Surgical interventions often worsen the disorder, and as a result treatments have emphasized use of pharmacologic agents, physical therapy, and repeated sympathetic nerve blocks.
Due to its sensitivity and unique ability to map and record the distribution and presence of skin temperature asymmetry (sympathetic skin response), thermography has facilitated breakthroughs in the way sympathetic pain is diagnosed and treated while improving the chances for a favorable treatment outcome.
Facial Thyroid Dental
Thyroid dysfunction accounts for a huge number of metabolic problems including but not limited to weight gain or loss, fatigue, disorders of protein, carbohydrate and fat metabolism and intolerance to heat or cold.
Conventional laboratory testing is often inaccurate due to various medical conditions that can falsely elevate or depress the thyroid function studies. Ultrasonography has a value in detecting anatomic lesions. Nuclear scans and x-rays involve injection of a radioactive dye which is less than desirable to most individuals.
Thermography offers a non-invasive, non-radiologic measurement of thyroid physiology. As such it will not detect nodules or tumors but will provide a representation of physiologic dysfunction which when coupled with history, physical examination and aforementioned tests will provide a far greater picture of the thyroid function.
People with normal studies who are still experiencing symptoms will now have definitive medical evidence which will allow for a more comprehensive treatment program.
When performing thyroid thermography we look for significant temperature asymmetry between the lobes or a temperature variation between the thyroid gland and its surrounding structures. When asymmetry is present the treating physician can use this information to assist in formulating a treatment plan that will lead to normalization.
Veterinary Thermography
Recommended Protocol for The Normal Thermographic Examination of The Horse
Recommended Protocol for the Normal Thermographic Examination of the Horse
The horse should be in a quiet, safe environment and secured with a halter and lead rope in the hands
of a competent handler. The horse should stand as squarely as possible with all four limb weights. The
thermographic examiner should be 4 to 6 feet away from the horse for the examination.
The following views constitute the standard complete thermographic examination of the horse:
Anterior views of the front legs.(3) In these scans the center of focus is the fetlocks, the carpi and the point of the shoulder. Because the legs of the horse are so long it is necessary to take multiple views with differing focal points in order to get truer perpendicular view with appropriate detail
for diagnostic use.
Anterior views of the chest and neck. (2)These scans should be focused at the sternum and at mid throat level.
Anterior views of the hind legs. (4) These scans are taken through the front legs and are focused at the fetlocks, the hocks, mid-thigh and at the stifle and groin area.
Perpendicular views of the Tarsi (hocks) and stifles. (4 -2 left and 2 right) Tarsi
(Hocks) and stifles are imaged separately from a true perpendicular anterior view because the normal anatomic position and confirmation of the horse is a turned out or tarsal valgus stance and to get correct scans the thermographer must be in a position slightly to the right or left of the horse.
Lateral views of the front legs. (6 -3 left and 3 right) The leg closest to the examiner should be positioned slightly forward. Focus should be the fetlocks, the carpi and the point of the sholder/upper elbow.
Lateral views of the hind legs. (6 -3left and 3 right) The leg closest to the examiner should be positioned slightly forward. Focus should be the fetlocks, tarsi and stifle
Lateral view of head, neck and shoulder. (6 -3 right and 3 left) In the shoulder scan the elbow should be positioned in the center and lower edge of the frame
Lateral view of back, abdomen and hind quarters. (6- 3 left and 3 right) The hind
quarter view should extend from the cranial area of the sacroiliac to the tail
Posterior views of the hind legs. (3) Focus should be on fetlocks, hocks and the upper
thigh or groin area
Posterior view of the croup, hip and upper thigh. (3)
Back. (2-3) This is an elevated view and the only time that the camera lens is not perpendicular to the surface of the horse. The scan is taken from behind the horse and includes the withers to the lumbar
area and then the lumbar to the tail head.
Posterior view of the front legs. (3) These scans are taken from behind the horse and
viewed through the hind legs. The focus should be on the fetlocks, the carpi and the elbows and ventral
pectoral region
Solar views of all 4 hooves. (4)
Normal Equine Thermal Images- Complete Protocol
Equine Thermographic Examination-Sample Images
Sample Reading List For Member Certification
Reading List for Medical Thermography
Books:
Vascular Diagnosis; Bernstein
Resolving Complex Pain; Schwartz
Rehabilitation Medicine & Thermography; Lee & Cohen
Medical Thermography Textbook: Principles and Applications; Brioschi
The Thermal Image in Medicine and Biology; K. Ammer, E.F.J/ Ring
Infrared Thermal Imaging; Michael Volumers
Medical Thermal Imaging; Diakides
The Textbook of Thermology; The Korean Society of Thermology
The Thermal Human Body: A Practical Guide to Thermal Imaging; K. Ammer, E.F.J/ Ring
Chapters/CME:
PMR Secrets, 4th Edition, Mosby (Elsevier) Press, 2023, Chapter E90, “Medicine through the lens of the autonomic nervous system: A thermographic approach”. Schwartz, Terzella, O’Young.
PMR Secrets, 4th Edition, Mosby (Elsevier) Press, 2023; Chapter 60 is titled “Peripheral vascular disease and lymphedema; localization and intervention”. Schwartz, Terzella.
Innovations in Pain Management; Weiner; Orthopedic Practice and the Use of Electronic Thermography; Uricchio
The Management Of Pain; Bonica; Thermography; LeRoy
Chronic Pain. Reflex Sympathetic Dystrophy Prevention and Management; Hooshmand.
Reflex Sympathetic Dystrophy; Stanton-Hicks
Chronic Regional Pain Syndrome (CRPS) and Reflex Sympathetic Dystrophy (RSD) for Primary Care Professionals. How to Diagnose and When to Refer to a Pain Specialist. Schwartz
Veterinarian Reference Lists:
Thermal Research Manuscripts (through 2015)
Evaluation and Treatment of Chronic Pain; Aronoff; Thermography as a Diagnostic Aid in the Management of Chronic Pain: An Updates: Leroy.
Reading List for Veterinary Thermography
VETERINARY THERMAL IMAGING READING LIST
THERMAL IMAGING GENERAL
Turner TA, Fessler JF, Purohit R: Thermography: A review in equine medicine. Comp Cont Ed, 8(11):855-862, 1986.
Waldsmith JK. Real-time thermography: a diagnostic tool for the equine practitioner. 38th Annu Conv Am Assoc Equine Pract 1992;38:455–466.
Mogg KC, Pollitt CC. Hoof and distal limb surface temperature in the normal pony under constant and changing ambient temperatures. Equine Vet J 1992;24:134–139
Turner TA: Uses and limitations of thermography. Pferdeheilkunde, 12(4), 684-685, 1996.
Turner TA:, Pansch J, Wilson JH: Thermographic assessment of racing Thoroughbreds. 47th Annual Meeting Am Assoc Eq Practnr, 2001: 344-346.
Tunley BV, Henson FM: Reliability and repeatability of thermographic examination and the normal thermographic image of the thoracolumbar region in the horse. Equine Vet J. 2004 May;36(4):306-12.
Simon EL, Gaughan EM, Epp T, Spire M: Influence of exercise on thermographically determined surface temperatures of thoracic and pelvic limbs in horses, J Am Vet Med Assoc, 229:12, 1940-1944, 2006
Loughmiller JA, Spire MF, Dritz SS, Fenwick BW, et al: Relationship between mean body surface temperature measured by use of infrared thermography and ambient temperature in clinically normal pigs and pigs inoculated with Actinobacillus pleuropneumoniae. American Journal of Veterinary Research, 62(5): 676-681, 2001.
Cockcroft PD, Henson FM, Parker C. Thermography of a septic metatarsophalangeal joint in a heifer. Vet Rec. 146:258–260, 2000.
G Gábor, R G Sasser, J P Kastelic, G H Coulter, G Falkay, M Mézes, S Bozó , J Völgyi-Csík, I Bárány, F Szász Jr: Morphologic, endocrine and thermographic measurements of testicles in comparison with semen characteristics in mature Holstein-Friesian breeding bulls. Anim Reprod Sci. 51 (3):215-24, 1998.
Yanmaz, L.E., Okumus, Z. Using Infrared Thermography to Detect Corneal and Extremity Temperatures of Healthy Horses. Israel Journal of Veterinary Medicine Vol. 69 (1) March 2014
Proceedings of the 11th International Congress of the World Equine Veterinary Association 24 – 27 September 2009 Guarujá, SP, Brazil Ana Paula Delgado da Costa, Paulo Bogossian, Brasilino Lignani Sobrinho USE OF THERMOGRAPHY TO MONITOR A HORSE WITH PLEUROPNEUMONIA
Viviane Castro, Anna Paula Balesdent Barreira1 ; Flávio Augusto Soares Graça, Fabiana Batalha Knackfuss Infrared pattern of sound horses in different environment temperatures Proceedings of the 11th International Congress of World Equine Veterinary Association, 2009 – Guarujá, SP, Brazil
Veronica Redaelli, Domenico Bergero, Enrica Zucca, Francesco Ferrucci, Leonardo Nanni Costa, Lorenzo Crosta, Fabio Luzi, Use of Thermography Techniques in Equines: Principles and Applications J Eq Vet Sci Vol 34(3) pp 345–350, 2014
Maria Soroko, Krzysztof Dudek,Kevin Howell, Ewa Jodkowska, Radomir Henklewski, Thermographic Evaluation of Racehorse Performance J Eq Vet Sci Vol 34(9)pp 1076-1083, 2014
S. Westermann, C. Stanek, J. P. Schramel, A. Ion, H. H. F. Buchner. The effect of airflow on thermographically determined temperature of the distal forelimb of the horse. Equine Veterinary Journal, 2013; DOI:10.1111/evj.12019
S Westermann, Heinz H. F. Buchner, Johannes P. Schramel, Alexander Tichy, Christian Stanek. Effects of infrared camera angle and distance on measurement and reproducibility of thermographically determined temperatures of the distolateral aspects of the forelimbs in horses. Journal of the American Veterinary Medical Association, 2013; 242 (3): 388
THERMAL IMAGING and EQUINE LAMENESS
Stromberg B. The normal and diseased flexor tendon in race horses. Acta Radial. (Suppl.) 305, 1, 1971
Stromberg B. and Norberg I., Infrared emission and Xe-disappearance rate studies in the horse. Equine Vet. J., 1, 1971.
Weil M1, Litzke LF, Fritsch R. Diagnostic validity of thermography of lameness in horses. Tierarztl Prax Ausg G Grosstiere Nutztiere. 1998 Nov;26(6):346-54. [Article in German]
Turner TA Thermography as an aid to the clinical lameness evaluation. Vet Clin North Am Equine Pract. 1991 Aug;7(2):311-38.
Turner TA: Diagnostic thermography,Vet Clin N.A.: Equine Pract. 17(1): 2001
Eddy AL, van Hoogmoed LM, Snyder JR. The role of thermography in the management of equine lameness. Vet J. 162:172–181, 2001.
Pick M. Initial results of thermographic studies in the diagnosis of lameness in horses using an infrared thermograph Tierarztl Prax. 1984;12(2):229-38. [Article in German]
In: NAVC Proceedings 2007, North American Veterinary Conference (Eds). Publisher: NAVC (www.tnavc.org). Internet Publisher: International Veterinary Information Service, Ithaca NY (www.ivis.org), Last updated: 13-Jan-2007.
T.A. Turner Use of Thermography in Equine Lameness Evaluation
Vaden MF, Purohit RC, McCoy MD, Vaughan JT. Thermography: a technique for subclinical diagnosis of osteoarthritis. Am J Vet Res; 41:1175–1179, 1980
Turner TA, Fessler JF, Lamp M, Pearce JA, Geddes LA: Thermographic evaluation of horses with podotrochlosis. Am J Vet Res 44(4):535-539, 1983.
Turner TA: Hindlimb muscle strain as a cause of lameness in horses. 35th Annu Meeting of Am Assoc of Equine Practnr, 1989: 281-290.
Marr CM. Microwave thermography: a non-invasive technique for investigation of injury of the superficial digital flexor tendon in the horse. Equine Vet J 1992;24:269–273
Denoix JM: Diagnostic techniques for identification and documentation of tendon and ligament injuries. Vet Clin North Am Equine Pract. Aug ,10 (2):365-407, 1994
Turner TA: Thermography as an aid in the localization of upper hindlimb lameness. Pferdeheilkunde, 12(4), 632-634, 1996.
Turner TA. Alternate methods of soft tissue imaging. Dubai Int Equine Symp: 165–176, 1996.
Turner TA: Use of thermography in lameness evaluation.44th Annu Meeting Am Assoc Eq Practnr, 1998: 224-226.
Turner TA: Evaluating the Sore Performance Horse In: NAVC Proceedings 2007, North American Veterinary Conference (Eds). Publisher: NAVC (www.tnavc.org). Internet Publisher: International Veterinary Information Service, Ithaca NY (www.ivis.org), Last updated: 13-Jan-2007.
Ana Paula Delgado da Costa, Brasilino Lignani Sobrinho, Paulo Bogossian, Lucas Pinho Vargas de Mendonça, Vitor Ayub Assaf Andrade, Alexandre Pio Viana THERMOGRAPHY IN THE EVALUATION OF HINDLIMB MUSCLES IN HORSES AFTER A CROSS-COUNTRY TEST Proceedings of the 11th International Congress of World Equine Veterinary Association, 2009 – Guarujá, SP, Brazil
Anna Carvalho Coutinho do Nascimento*, Eduardo Ferreira da Fonseca1 , Meryonne Moreira Influence of hot shoe fitting on the superficial thermal pattern of the distal limbs of horses Proceedings of the 11th International Congress of World Equine Veterinary Association, 2009 – Guarujá, SP, Brazil
Maria Soroko, Radomir Henklewski, Henryk Filipowski, Ewa Jodkowska, The Effectiveness of Thermographic Analysis in Equine Orthopedics. J Eq Vet Sci, vol 33 (9) pp 760-762, 2013
THERMAL IMAGING and THERAPEUTICS
Bowmen KF, Purohit RC, et. al. Thermographic evaluation of corticosteroid efficacy in amphotericin B- induced arthritis in horses. Am. J. Vet. Res. 44, 51-56, 1983.
Turner TA, Wolfsdorf K, Jourdenais J: Effects of heat, cold, biomagnets and ultrasound on skin circulation in the horse. 37th Annu Meeting of Am Assoc of Equine Practnr, 1991: 249-257
Ringer SK, Lischer CJ, Ueltschi G: Assessment of scintigraphic and thermographic changes after focused extracorporeal shock wave therapy on the origin of the suspensory ligament and the fourth metatarsal bone in horses without lameness American Journal of Veterinary Research , 66(10): 1836-1842, 2005.
Verna M, Turner TA, Anderson K: Scintigraphic, radiographic, and thermographic appearance of the metacarpal and metatarsal regions of adult healthy horses treated with non-focused extracorporeal shockwave therapy-a pilot study. Vet Therapeutics, 6(3): 268-276, 2005
A. Edner, L.-G. Lindberg, H. Broström and A. Bergh: Does a magnetic blanket induce changes in muscular blood flow, skin temperature and muscular tension in horses? EQUINE VETERINARY JOURNAL, Vol 47 (3) May 2015, pp: 302–307,
THERMAL IMAGING and BACK PAIN
Von Schweinitz: Thermographic diagnostics in equine back pain. Vet Clin North Am Equine Pract. Apr, 15 (1):161-77, 1999
Tomlinson JT, Sage AM, Turner TA: Ultrasonographic examination of the normal and diseased equine pelvis. 46th Annual Meeting Am Assoc Eq Practnr, 2000: 375-377.
Turner TA: Back problems in horses. 49th Annual Meeting Am Assoc Eq Practnr, 2003: 71-74.
Turner TA: Diagnosis and treatment of back pain in horses Proceedings of the Annual Meeting of the Italian Association of Equine Veterinarians, Carrara, Italy 2010, pp 157-160
Turner TA Overriding Spinous Processes (“Kissing Spines”) in Horses: Diagnosis, Treatment, and Outcome in 212 Cases AAEP PROCEEDINGS, 57, 2011 pp 424-430
Mariana PavelskiI, Mardjory da Silva Basten, Eduarda BusatoII Peterson, Triches Dornbusch: Infrared thermography evaluation from the back region of healthy horses in controlled temperature room Ciência Rural, Santa Maria, v.45 (7) p.1274-1279, 2015
J. E. TOMLINSON, A. M. SAGE and T.A. TURNER Ultrasonographic abnormalities detected in the sacroiliac area in twenty cases of upper hindlimb lameness. EQUINE VETERINARY JOURNAL, Vo 35 (1) January 2003, pp: 48–54,
THERMAL IMAGING and SADDLE FIT
Turner TA, Waldsmith JK, Wilson JH: How to assess saddle fit in horses. 50th Annual Meeting Am Assoc Eq Practnr, 2004: 196-201.
Turner TA: How to Assess Saddle Fit In: NAVC Proceedings 2007, North American Veterinary Conference (Eds). Publisher: NAVC (www.tnavc.org). Internet Publisher: International Veterinary Information Service, Ithaca NY (www.ivis.org), Last updated: 13-Jan-2007.
THERMAL IMAGING and INFLAMMATION
Collins, A.J. and Ring, E.F.J. Measurement of inflammation in man and animals. Br. J. Pharm., 44,145, 1972.
Spire MF, Drouillard JS, Galland JC, Sargeant JM: Use of infrared thermography to detect inflammation caused by contaminated growth promotant ear implants in cattle.Journal of the American Veterinary Medical Association [1999, 215(9):1320-1324]
Purohit RC, McCoy MD. Thermography in the diagnosis of inflammatory processes in the horse. Am J Vet Res; 41:1167–1174, 1980.
Waldsmith JK, Oltmann JI. Thermography: subclinical inflammation, diagnosis, rehabilitation, and athletic evaluation. J Equine Vet Sci.14:8–10, 1994.
T. Levet, A. Martens, L. Devisscher, L. Duchateau, L. Bogaert and L. Vlaminck: Distal limb cast sores in horses: Risk factors and early detection using thermography. EQUINE VETERINARY JOURNAL, Vol 41(1) January 2009, pp 18–23
THERMAL IMAGING and NERVES/NEUROLOGY
Purohit RC, McCoy MD, Bergfeld WA: Thermographic diagnosis of Horner’s Syndrome in the Horse. Am J Vet Res 41, pp 1180-1182, 1980
Purohit RC., DeFranco B. Infrared thermography for determination of cervical dermatome patterns in the horse. Biomed. Thermology, 15, 213-215, 1995.
Holmes LC, Gaughan EM, Gorondy DA, Hogge S, Spire MF: The effect of perineural anesthesia on infrared thermographic images of the forelimb digits of normal horses. Can Vet J. 44(5): 392–396, 2003.
Purohit RC, Pascoe DD, DeFranco B, Schumacher J. Thermography evaluation of the neurovascular system in the equine. Thermology International. 14, 89-92, 2004.
Yasmine Ghafir, Tatiana Art and P. Lekeux Thermographic facial pattern following an α2-adrenergic agonist injection in two horses suffering from Horner’s syndrome. EQUINE VETERINARY EDUCATION, Vol 8 (4) August 1996, pp 192–195,
THERMAL IMAGING and REGULATORY MEDICINE
Nelson HA, Osheim DL. Soring in Tennessee walking horses: detection by thermography. USDA-APHIS, Veterinary Services Laboratories, Ames, Iowa, pp.1-14, 1975
Turner TA, Scoggins RD: Thermographic detection of gingering in horses. J Eq Vet Sci, 5(1):8-10, 1985
van Hoogmoed L, Snyder JR, Allen AK, Waldsmith JD. Use of infrared thermography to detect performance-enhancing techniques in horses. Equine Vet Educ 2000;12:102–107.
Tatiana Figueiredo, Bruna Dzyekanski, Cláudia T. Pimpão, Andressa B. Silveira, Luiz G. Capriglione, Pedro Vicente Michelotto Jr.Use of Infrared Thermography to Detect Intrasynovial Injections in Horses J Eq Vet Sci Vol 33(4) pp 257–260, 2013
THERMAL IMAGING and COMPANION ANIMALS
Loughin CA, Marino DJ: Evaluation of thermographic imaging of the limbs of healthy dogs. American Journal of Veterinary Research, 68(10): 1064-1069, 2007.
Proceedings of the European Veterinary Conference Voorjaarsdagen Amsterdam, the Netherlands Apr. 23-25, 2009 Dr. Nicolae Coldea, DVM, Romania THERMOGRAPHY AS AN ADDITIONAL METHOD IN SMALL ANIMAL IMAGING
Tomas Infernuso, Catherine A. Loughin, Dominic J. Marino, Scott E. Umbaugh and Patrick S. Solt: Thermal Imaging of Normal and Cranial Cruciate Ligament-Deficient Stifles in Dogs. VETERINARY SURGERY, Vol 39 (4) June 2010, pp: 410–417
Dominic J. Marino and Catherine A. Loughin: Diagnostic Imaging of the Canine Stifle: A Review. VETERINARY SURGERY, Vol 39 (3) April 2010, pp: 284–295,
McGowan L, Loughin CA, Marino DJ, et al: Medical Infrared Imaging of Normal and Dysplastic Elbows in Dogs, VETERINARY SURGERY, Vol 44 Sept 2015, pp:
THERMAL IMAGING and ZOO and WILDLIFE
European Association of Zoo- and Wildlife Veterinarians (EAZWV) 4th scientific meeting, joint with the annual meeting of the European Wildlife Disease Association (EWDA) May 8-12, 2002, Heidelberg, Germany. S. HILSBERG: CLINICAL APPLICATION OF INFRARED-THERMOGRAPHY IN INFLAMMATION DIAGNOSIS IN MEGA-HERBIVORES
Justyna Cilulko,Paweł Janiszewski, Marek Bogdaszewski, Eliza Szczygielska: Infrared thermal imaging in studies of wild animals European Journal of Wildlife Research Vol 59 (1) pp 17-23, 2013
Mike R. Dunbar M.S., Kathleen A. MacCarthy: USE OF INFRARED THERMOGRAPHY TO DETECT SIGNS OF RABIES INFECTION IN RACCOONS (PROCYON LOTOR) University of Nebraska – Lincoln DigitalCommons@University of Nebraska – Lincoln USDA National Wildlife Research Center – Staff Publications Wildlife Damage Management, Internet Center for 2-20-2006
Mike R. Dunbar, Shylo R. Johnson, Jack C. Rhyan, and Matt McCollum: Use of Infrared Thermography to Detect Thermographic Changes in Mule Deer (Odocoileus hemionus) Experimentally Infected with Foot-and-Mouth Disease. Journal of Zoo and Wildlife Medicine: June 2009, Vol. 40, No. 2, pp. 296-301.
Michael T. Walsh, John Thompson: Use of Thermography As a Diagnostic and Prognostic Tool in Selected Cetacean Conditions, Am Assoc Zoo Vets Proceedings date?
OTHER
1. Brioschi, M, Manual de termografia médica, 2012.
2. M. Soroko and M.C.G. Davies Morel, Equine Thermography in Practice, 2016.
3. Infrared thermography in the evaluation of skin temperature applications in musculoskeletal conditions, Forestry and Natural Sciences,University of Eastern 2015.
4. BRELAZ Marie, ECOLE NATIONALE VETERINAIRE DE TOULOUSE, INTÉRÊTS ET LIMITES DE LA THERMOGRAPHIE INFRAROUGE EN TANQU’OUTIL DIAGNOSTIQUE EN AVICULTURE, THESE : 2011 – TOU 3 – 4083.
5. J,D; S,M; D,K, Temperature range analysis (Tmax) on dorsal surface of sporting horses Turkish Journal of Veterinary and Animal Sciences · January 2015 DOI: 10.3906/vet-1410-17
6. Brioschi,M, Diferença entre Gêneros no Teste de Reatividade Vascular com Termografia por Radiação Infravermelha 2015 DOI: 10.18073/2358-4696/pajmt.v2n2p78-85
7. S,E; F,J; BM ,Infrared thermography cutaneous in the evaluationof atherosclerosis, Universidade Federal de São Paulo, São Paulo, SP, Brazil doi:10.1016/j.bbacli.2015.05.031
8. S,G; J,I; B,M MÉTODO AUTOMÁTICO PARA DETECÇÃO DE ASSIMETRIA TÉRMICA CORPORAL POR TERMOGRAFIA INFRAVERMELHA. XXV Congresso Brasileiro de Engenharia Biomédica – CBEB 2016.
9. S,C; G,M; V,J Thermographic Applications in Veterinry Medicine, Univesity of Padova-Italy, Doi: 5772/29135.
10. V,M, thermographic imaging in chats and dogs, Usability as clinical method, University Helsinki-Finland, 2014
11. C,I, Effect of endurance, spread and strength training on skin temperature measured by infrared thermography, Universidad Politécnica de Madri, tese doutorado 2012
12. V,M, A comparison of thermographic imaging, physical examination and modified questionnaire as an instrument to assess painful conditions in cats J Feline Med Surg. 2013 DOI: 10.1177 / 1098612X12463926
13. M,C; B,M, Infrared thermography to diagnose and manage venomous animal bites and sting, Rev Soc Bras Mad Trip 50(2):260-264, 2017, DOI: 10.1590/8682-0390-2016.
14. B,V; S,L, Assessement of surface temperuartures of Buffalo build (Bubalus bubalis) raízes fundar tropical comditions using infrared thermography, Arq.Bras.Med.Vet.Zoot, v68,n2,p422-430 https://dx.doi.org/10.1590/1678-4162-8327.
15. M,M, Thermal referência points as na index for monitoring body temperature in marine mammls, BMC 2015, Madri- Spain, DOI: 10.1186/s113104-015-1383-6.
16. D,G, Skin temperature and reprodutiva condition in will semana chimpanzees, Peerj 2017, DOI : 10.7717/ Peerj.4116.
17. O,K, The use of infrared thermography to detect the stables of Astrud cycle and ovulation time in anatomia shepherd dogs, Journal of Animal Science and Technology, 2017, 59-21 DOI : 10.1186/s40781-017-0146-4.
18. R,V, Use of thermography imaging in clinical diagnose of e-mail animall: preliminary notes, And Its Super Sanità 2014|Vol 50, n 2: 140-146 DOI: 10.4415/ANN_14_02_06.
19. Calkosinski,I, The Use of Thermography as a Rapid, Quantitative, and Noninvasive Method for Evaluation of Inflammation Response in Different Anatomical Regions of Rats, Hindawi Publising Corporation BioMed Research International,2015, Arq ID972535, 9 pg, https://dx.doi.org/10.1155/2015/972535.
20. B,S, Relationship between Tongue Temperature Estimated by Infrared Thermography, Tongue Color, and Cold-heat Pathological Patterns: A Rerospective Chart Review Study, Evidence-Based Complementary and Alternativa Medicine, Vol 2018, Arq ID 6841460, 8 pg, https://doi.org/10.1155/2018/6841460.
21. UM,S, Thermographic Evaluation for the Efficacy of Acupunture on Índices Chronic Artritis in the Dor, J.Vet.Med.Sci 67(12): 1283-1284, 2005.
22. V,M, Comparison of Three Thermal Cameras with Canina Vip Area Thermographic Images, J.Vet.Med.Sci 74(12): 1539-1544, 2012, doi:10.1292/jvms12-0180.
23. Childs,C, Body temperature and clinical thermometry, Thermoregulation: From Basic Neuroscience to Clinical Neurology, https://doi.org/10.1016/B978-0-444-64074-1.00029-X.
24. N,C, Infrared thermography: a rapid and accurate technique to detect feline aortic thromboembolism , J Feline Med Surg. 2017 https://doi.org/10.1177/1098612X17732485.
25. V,M, Thermographic Imaging of the Superficial Temperature in Racing Greyhounds before and after the Race, TheScientificWorldJournal, 2012,DOI :10.1100/2012/182749.
26. V,M Thermographic imaging of superficial temperature in dogs sedated with medetomidine and butorphanol with and without MK-467 (L-659’066) VL – 40 DO – 10.1111/j.1467-2995.2012.00768.x JO – Veterinary anaesthesia and analgesia, 2012.
27. Charkoudian, N Skin blood flow in adult human thermoregulation: how it works, when it does not, and why. Mayo Clin Proc. 2003 May;78(5):603-12. DOI:10.4065/78.5.603.
28. Brioschi,M, IR Remote Sensing to Measure Human Being Stress Level, InfraMation 2010 P-131
29. Brioschi,M, Skin thermometry: new concepts Vasc Br 2003, Vol. 2, Nº2 151-60.
30. Vardasca,R, The influence of inglês and distance on assessing inner-canthi of até skin temperature, Thermology International 27/4 2017.
31. Z,M, First Evaluation of Infrared Thermography as a Tool for the Monitoring of Udder Health Status in Farms of Daisy Cows, Sensors 2018, 18, 862; doi: 10.3390/s18030862.
32. Medina,D, Dolor y Termografia, httpp:/dx.doi.org/10.22402/j.rdipycs.unam.4.1.2018.164.109-117.
33. B,C Remote Welfare Monitoring of Rodents Using Thermal Imaging, sensors-18-03653-s001.zip (68M)GUID: 4552021D-53A2-4D83-90B0-0138C737C24D
34. Stewart,M Non-invasive measurement of stress in dairy cows using infrared thermography Physiology & Behavior https://doi.org/10.1016/j.physbeh.2007.04.034.
35. Durozey, M, Validatinon de L’utlisation de la Thermographie Infrarouge Pour la Mise em Évidence eu Stress Chez lá Chegam de Spetacle., École Nationale Vétérinaire D’Alfort, thèse doctorat,2014. Wael A Khama; Skin histology and its role in heat dissipation inthree pinniped species Khamas et al. Acta Veterinaria Scandinavica 2012, 54:46
36. Kun Zhang; An instantaneous approach for determining the infrared emissivity of swine surface and the influencing factors, Journal of Thermal Biology 57 (2016) 78–83
37. Owda Y ; Millimeter-Wave Emissivityas a Metric for the Non-Contact Diagnosis of Human Skin Conditions; Bioelectromagnetics 38:559^569 (2017)
38. Prindeze NJ, Heat transfer analysis and resolution quantification of active dynamic thermography through human skin. Lasers Surg Med. 2018 Jan 25. doi: 10.1002/lsm.22790. PMID:29369378
39. Codde SA ; Effects of environmental variables on surface temperature of breeding adult female northern elephant seals, Mirounga angustirostris, and pups. J Therm Biol. 2016 Oct;61:98-105. doi: 10.1016/j.jtherbio.2016.09.001. Epub 2016 Sep 4.
40. Gläser N, Variation in rhinarium temperature indicates sensory specializations in placental mammals.J Therm Biol. 2017 Jul;67:30-34. doi: 10.1016/j.jtherbio.2017.04.010. Epub 2017 May 3.PMID28558934
41. Horton W T; Thermal Imaging and Biometrical Thermography of Humpback Whales Front. Mar. Sci., 21 December 2017 | https://doi.org/10.3389/fmars.2017.00424
42. Church JS Influence of environmental factors on infrared eye temperature measurements in cattle. Res Vet Sci. 2014 Feb;96(1):220-6. doi: 10.1016/j.rvsc.2013.11.006. Epub 2013 Nov 19
43. Grace MS; The Python pit organ: imaging and immunocytochemical analysis of an extremely sensitive natural infrared detector. Biosens Bioelectron. 1999 Jan 1;14(1):53-9. PMID:10028649
44. Björn LO Thermal emissivity of avian eggshells. J Therm Biol. 2016 Apr;57:1-5. doi: 10.1016/j.jtherbio.2015.11.008. Epub 2016 Jan 4.PMID:27033033
45. Denis D; Determining the emissivity of pig skin for accurate infrared thermography https://doi.org/10.1016/j.compag.2014.09.003
46. Edelman GJ,Infrared imaging of the crime scene: possibilities and pitfalls. J Forensic Sci. 2013 Sep;58(5):1156-62. doi: 10.1111/1556-4029.12225. Epub 2013 Aug 6.PMID:23919285
47. Martı´nez-Jime´nez MM; Development and validation of an algorithm to predict the treatment modality of burn wounds using thermographic scans:Prospective cohort study; https://doi.org/10.1371/journal.pone.0206477
48. Knížková I; APPLICATIONS OF INFRARED THERMOGRAPHY IN ANIMAL PRODUCTION J. of Fac. of Agric., OMU, 2007,22(3):329-336 Zir. Fak. Dergisi, 2007,22(3): 329-336
49. OVIDIU GRIGORE; Role of stress in modulation of skin neurogenic inflammation EXPERIMENTAL AND THERAPEUTIC MEDICINE 17: 997-1003, 20196 DOI: 10.3892/etm.2018.7058
50. Nowicka D; Thermography Improves Clinical Assessment in Patientswith Systemic Sclerosis Treated with Ozone; Therapy BioMed Research International Volume 2017, Article ID 5842723, 7 pages http://dx.doi.org/10.1155/2017/5842723
51. SOBCZYŃSKA-RAK, ALEKSANDRA Use of ozone in medicine and veterinary practice; 74DO – 10.21521/mw.5974JO – Medycyna Weterynaryjna 2018
52. T. Celakil;Effect of high‐frequency bio‐oxidative ozone therapy for masticatory muscle pain: a double‐blind randomised clinical trial https://doi.org/10.1111/joor.12506 2017
Sample Reports
Sample Upper Body NMSK SSR Report
SAMPLE UPPER BODY SYMPATHETIC SKIN RESPONSE PDF
Autonomic reflex testing can be accomplished through sympathetic galvanic skin response studies. Skin galvanic impedance can be measured with infrared detectors and then mapped upon
the skin. Results are both recorded and stored in digital format.
The patient was allowed to equilibrate for 15 minutes in a temperature and draft-controlled environment prior to the study. The study was performed three times. The patient was allowed to re-equilibrate for 15 minutes prior to repeating the study each time. All studies performed were resting and under cold stress.
While galvanic impedance asymmetries correlate to skin temperature, they do not necessarily describe dermatomes, myotomes or sclerotomes. Localized pathology may represent either
peripheral nerve irritation, sympathetic dysfunction syndromes, peripheral vascular abnormalities or localized inflammatory and myofascial conditions. At least 25% of a region of interest must
be asymmetric in at least two different areas to be consistent with a thermal pattern. Clinical correlation is necessary to make this determination.
This infrared sympathetic galvanic skin response study was performed with a 640X480 camera and included evaluation of the posterior neck and shoulders, the anterior, posterior, medial and lateral arms and the palmar and dorsal aspects of the hands.
Sympathetic Skin Response Findings: There is a sympathetic skin response asymmetry pattern over the . The rest of the areas studied showed a symmetric profile. There was a symmetric sympathetic skin response present in all areas studied.
Sympathetic Skin Response Impression: Asymmetric SSR is present in a distribution. Compared to the surrounding areas localized SSR findings are present over the . This is a normal study.
Clinical Impression: Sympathetic dysfunction should be considered. The is cold compared to the contralateral side.
This would tend to r/o a sympathetically mediated pain syndrome.
Sample Lower Body NMSK SSR Report
SAMPLE LOWER BODY SYMPATHETIC SKIN RESPONSE
Autonomic reflex testing can be accomplished through sympathetic galvanic skin response
studies. Skin galvanic impedance can be measured with infrared detectors and then mapped upon the skin. Results are both recorded and stored in digital format.
The patient was allowed to equilibrate for 15 minutes in a temperature and draft-controlled environment prior to the study. The study was performed three times. The patient was allowed to re-equilibrate for 15 minutes prior to repeating the study each time. All studies performed were resting and under cold stress.
While galvanic impedance asymmetries correlate to skin temperature, they do not necessarily describe dermatomes, myotomes or sclerotomes. Localized pathology may represent either
peripheral nerve irritation, sympathetic dysfunction syndromes, peripheral vascular abnormalities or localized inflammatory and myofascial conditions. At least 25% of a region of interest must
be asymmetric in at least two different areas to be consistent with a thermal pattern. Clinical correlation is necessary to make this determination.
This infrared sympathetic galvanic skin response study was performed with a 640X480 camera and included evaluation of the back and buttocks, the anterior, posterior, medial and lateral aspect of the legs and feet.
Sympathetic Skin Response Findings: There is a sympathetic skin response asymmetry pattern over the . The rest of the areas studied showed a symmetric profile. There was a symmetric sympathetic skin response present in all areas studied.
Sympathetic Skin Response Impression: Asymmetric SSR is present in a distribution. Compared to the surrounding areas localized SSR findings are present over the . This is a normal
study.
Clinical Impression: Sympathetic dysfunction should be considered. The is cold compared to the contralateral side.
This would tend to r/o a sympathetically mediated pain syndrome.
Sample Facial NMSK SSR Report
SAMPLE FACIAL & PERIPHERAL SYMPATHETIC SKIN RESPONSE
Autonomic reflex testing can be accomplished through sympathetic galvanic skin response studies. Skin galvanic impedance can be measured with infrared detectors and then mapped upon
the skin. Results are both recorded and stored in digital format.
The patient was allowed to equilibrate for 15 minutes in a temperature and draft-controlled environment prior to the study. The study was performed three times. The patient was allowed to re-equilibrate for 15 minutes prior to repeating the study each time. All studies performed were resting and under cold stress.
While galvanic impedance asymmetries correlate to skin temperature, they do not necessarily describe dermatomes, myotomes or sclerotomes. Localized pathology may represent either peripheral nerve irritation, sympathetic dysfunction syndromes, vasomotor headaches (Barre
Lieou), inflammatory sinus conditions, peripheral vascular abnormalities, and myofascial conditions. Clinical correlation is necessary to make this determination.
This infrared sympathetic galvanic skin response study was performed with a 640X480 camera and included evaluation of the anterior and lateral aspects of the face, the anterior neck strap muscles, the posterior shoulder girdle, medial aspects of the arm and forearm, and cervical
paraspinals.
This infrared sympathetic galvanic skin response study included evaluation of the anterior and lateral aspects of the face, the anterior neck strap muscles, the posterior shoulder girdle and cervical paraspinal muscles, and the medial aspect of the arms and forearms.
Sympathetic Skin Response Findings: There is a sympathetic skin response asymmetry pattern over the . The rest of the areas studied showed a symmetric profile. There was a symmetric sympathetic skin response present in all areas studied.
Sympathetic Skin Response Impression: Asymmetric SSR is present in a distribution. Compared to the surrounding areas localized SSR findings are present over the . This is a normal
study.
Clinical Impression: Sympathetic dysfunction should be considered. The is cold compared to the contralateral side.
This would tend to r/o a sympathetically mediated pain syndrome.
Sample Breast Report
SAMPLE REPORT: INFRARED BREAST THERMOGRAPHY
Digital infrared breast thermography measures surf ace temperature and maps surf ace hypervascularity and hyperthermia. Since both of these have been associated with angiogenesis Infrared imaging can play a role in breast thermal findings assessment.
Infrared Breast Thermal Imaging is not a standalone study and should be considered adjunctive in monitoring
breast health. Results should be collaborated with other tests such as radiographic mammography, ultrasound and clinical breast exam. This study and report generation was performed in accordance with AAT Breast Guidelines.
Frontal, inferior, posterior, b il a te r a l oblique and lateral views in both color and black/white palettes were obtained. Cold stress tests are then performed. Laboratory temperature was recorded. Breast results are graded as TH1: Normal Uniform Non-vascular, TH2: Symmetrical Vascular (non-suspicious), TH3:
Equivocal, TH4: One- two factors present (moderately suspicious) TH 5: Three factors present (highly suspicious). Patients s/p lumpectomy or mastectomy are designated with an "L" or "M".
Infrared Digital Breast Mammography Findings: There is no evidence of hypervascularity or hyperthermia in
either breast on infrared breast imaging. Posterior views were normal. Cold stress study results were normal.
Conclusion: Breast findings are consistent with class: THl: Normal Uniform Non-vascular, bilat.
Clinical Impression: The role of Thermography as a Breast Thermal Findings Assessment reviewed. Follow up
with patient's primary breast health physician recommended. Annual surveillance recommended.
Sample Whole Body Screening Report
WHOLE BODY SCREENING THERMOGRAPHY REPORT OF FINDINGS
Name of Client:
Date of Examination:
ID Number:
This Thermographic Whole Body Screening Protocol is intended to be an extension of a proper physical examination. It utilizes Reference Protocol postures as approved by the Artificial
Intelligence Infrared Alliance (AIIR) as promulgated by the American Academy of Thermology (AAT). It is not to be confused with whole body examinations that are done outside of AAT Guidelines. Results are both recorded and stored in digital format.
The client was allowed to equilibrate for 15 minutes in a temperature and draft-controlled environment prior to the study such that the client was neither warm enough to induce sweating
of cold enough to induce shivering.
Thermographic findings correlate to surface skin temperature. Localized and regional call outs, asymmetries, and areas of hypervascularities (findings) may represent areas of interest. In
general variances of > 1o C are reported, however at times lesser temperature differences may be of interest. Findings do not necessarily describe or infer any aberration of physiology. Clinical
correlation is necessary to make this determination.
This Report of Findings does not constitute medical advice and is meant to be adjunctive only. Images were obtained by the thermographer with a 640X480 imager and results are to be submitted to the client by that person who is Responsible for reviewing the findings with the client.
Thermography Report of Findings: Asymmetric findings were present over the . Localized call outs include . The rest of the areas studied showed a symmetric profile. There was a symmetric sympathetic skin response present in all areas imaged.
Thermographic Impression: Asymmetric findings were present over the . Localized call outs include . There was a symmetric sympathetic skin response present in all areas imaged.
Report of Thermographic Findings Approved By:
________________________________________
Artificial Intelligence Infrared (AIIR) DICOM Compliant Protocols
The AIIR DICOM image protocols for CLINICAL studies are contained within this link.
The AIIR DICOM image protocol for RESEARCH is contained within this link.
The AIIR DICOM image protocol for WHOLE BODY SCREENING is contained within this link.
Additional study types will be added as they are approved.
Want to see images? Check out the Atlas of Normal Thermology.